An appealing layout and a well-thought-out design are crucial for presenting the content of your reports in an engaging way. In this tutorial, you will dive straight into the basics of layout and design in Google Data Studio. Here, you will learn how to customize your reports so that they are both informative and visually appealing.
Main Insights
- Google Data Studio allows you to link reports to various data sources.
- The design of layout and style is crucial for user experience.
- You can customize various elements such as background colors, fonts, and borders.
Step-by-Step Guide
Step 1: Create a Report
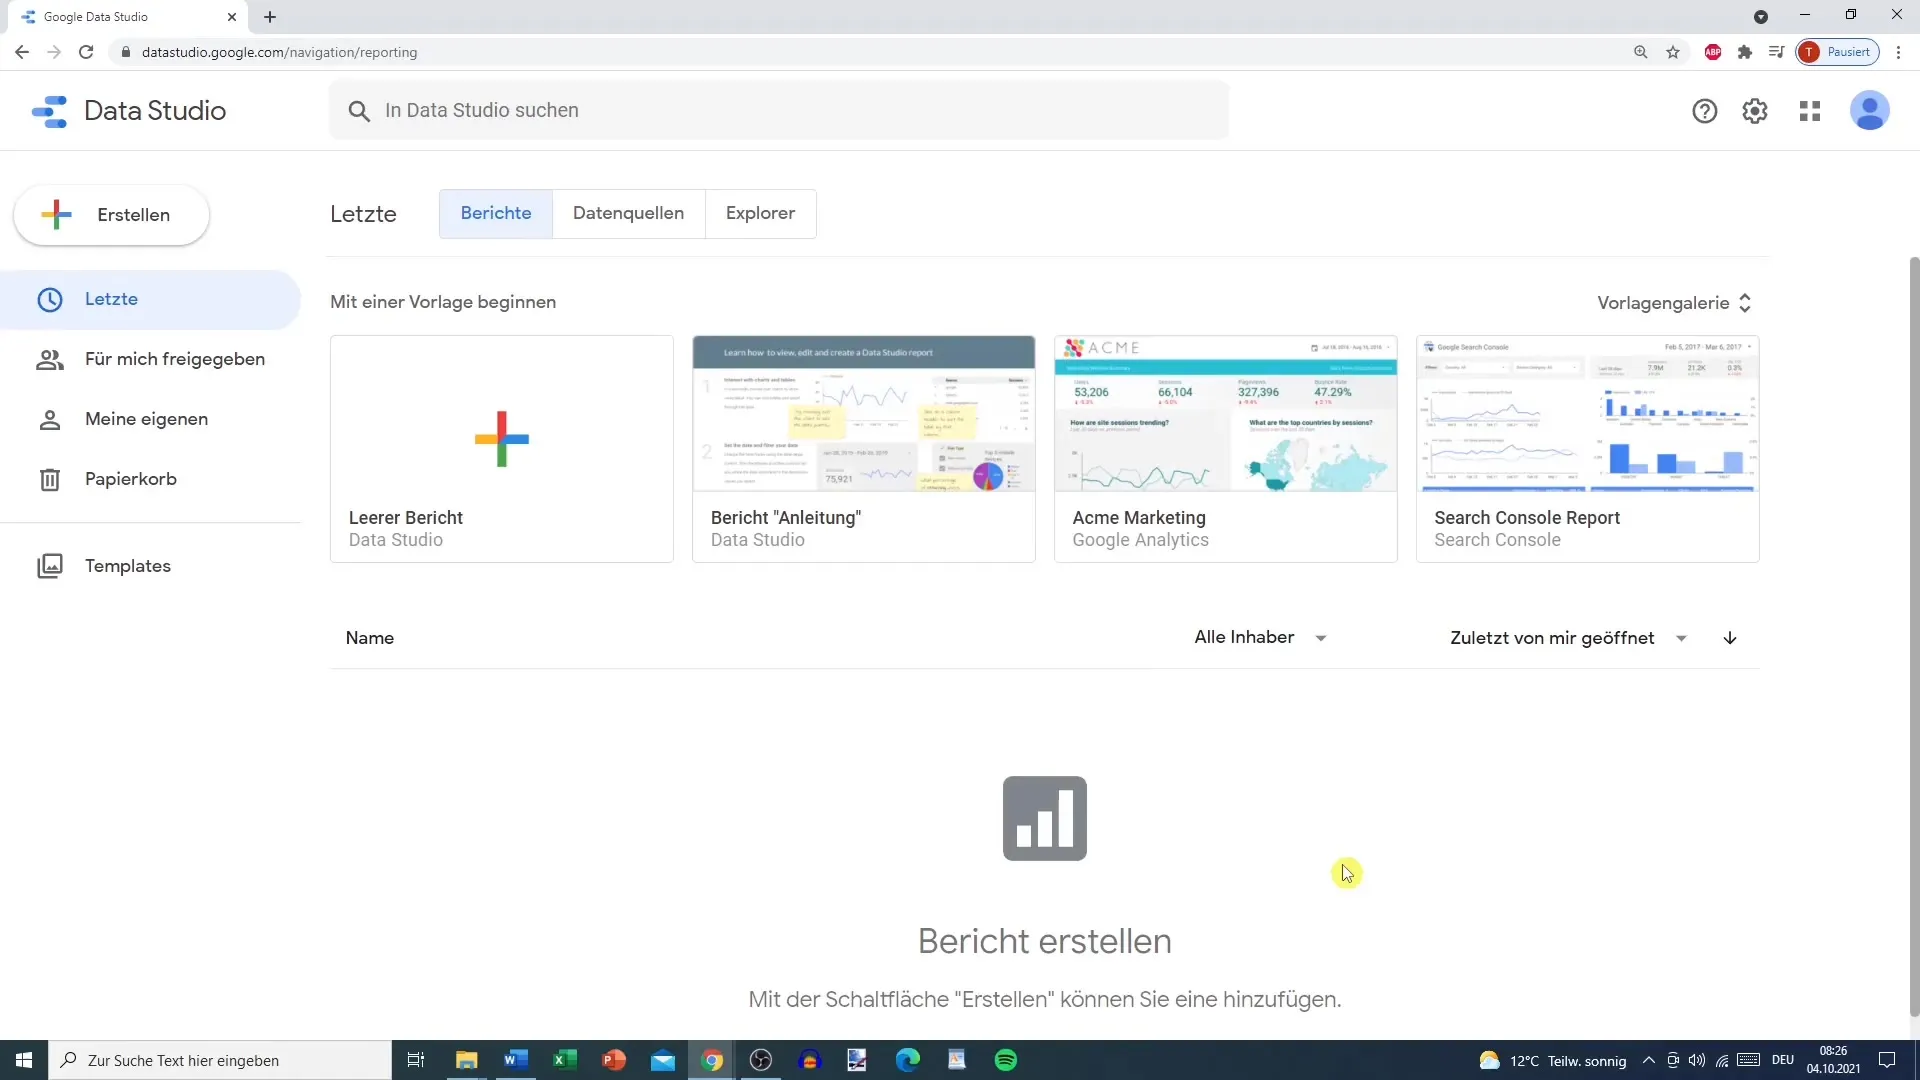
Start the tutorial by opening Google Data Studio. Sign in and select the report you want to work on. If you don't have any reports yet, you can easily create a new report and add the necessary data sources.
Step 2: Link Data Source
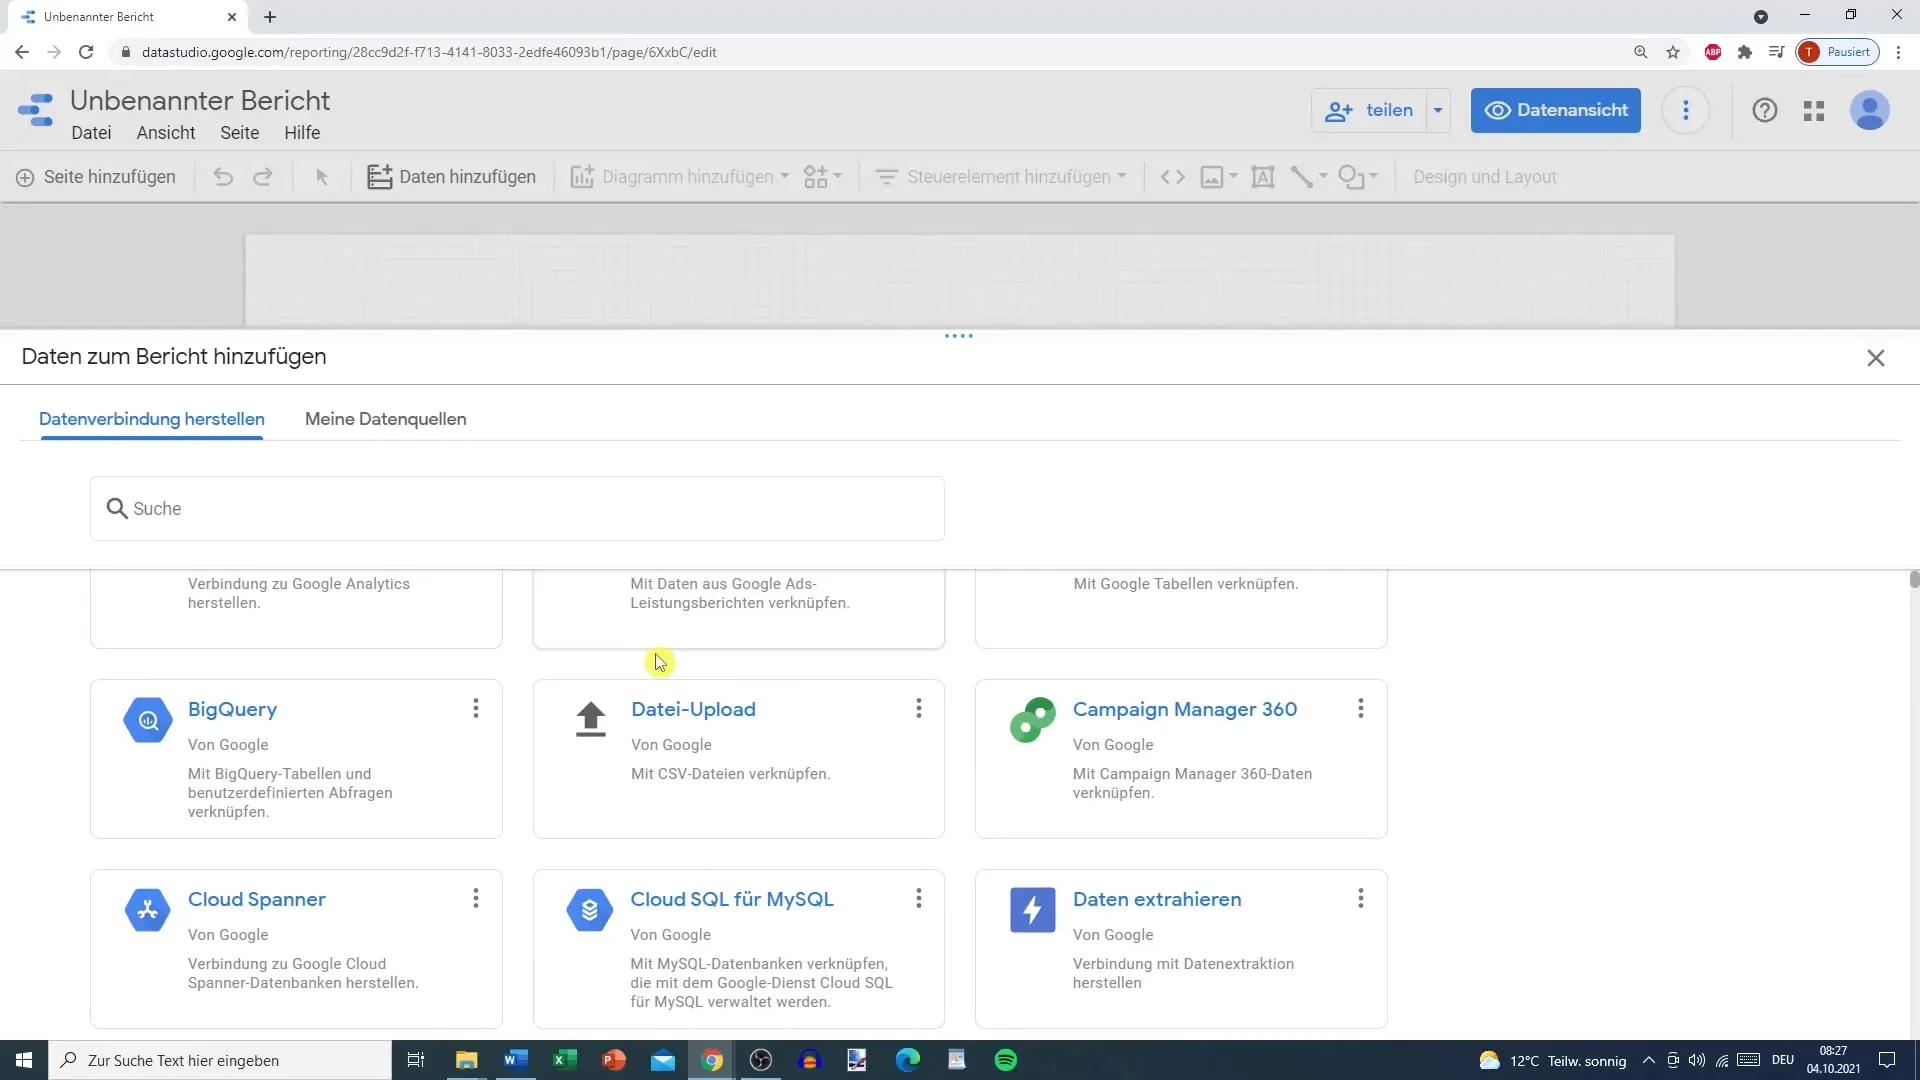
Click the "Add Data" button to link a data source. Google Data Studio offers a variety of Google connectors, such as Google Analytics or Google Ads. You can also upload your own data sources, like CSV or XML files.
Step 3: Select the Added Data Source
After selecting your data source, you will see all added data sources in the report on the left side. Click on the desired data source to insert it into your report.
Step 4: Customize Layout and Design
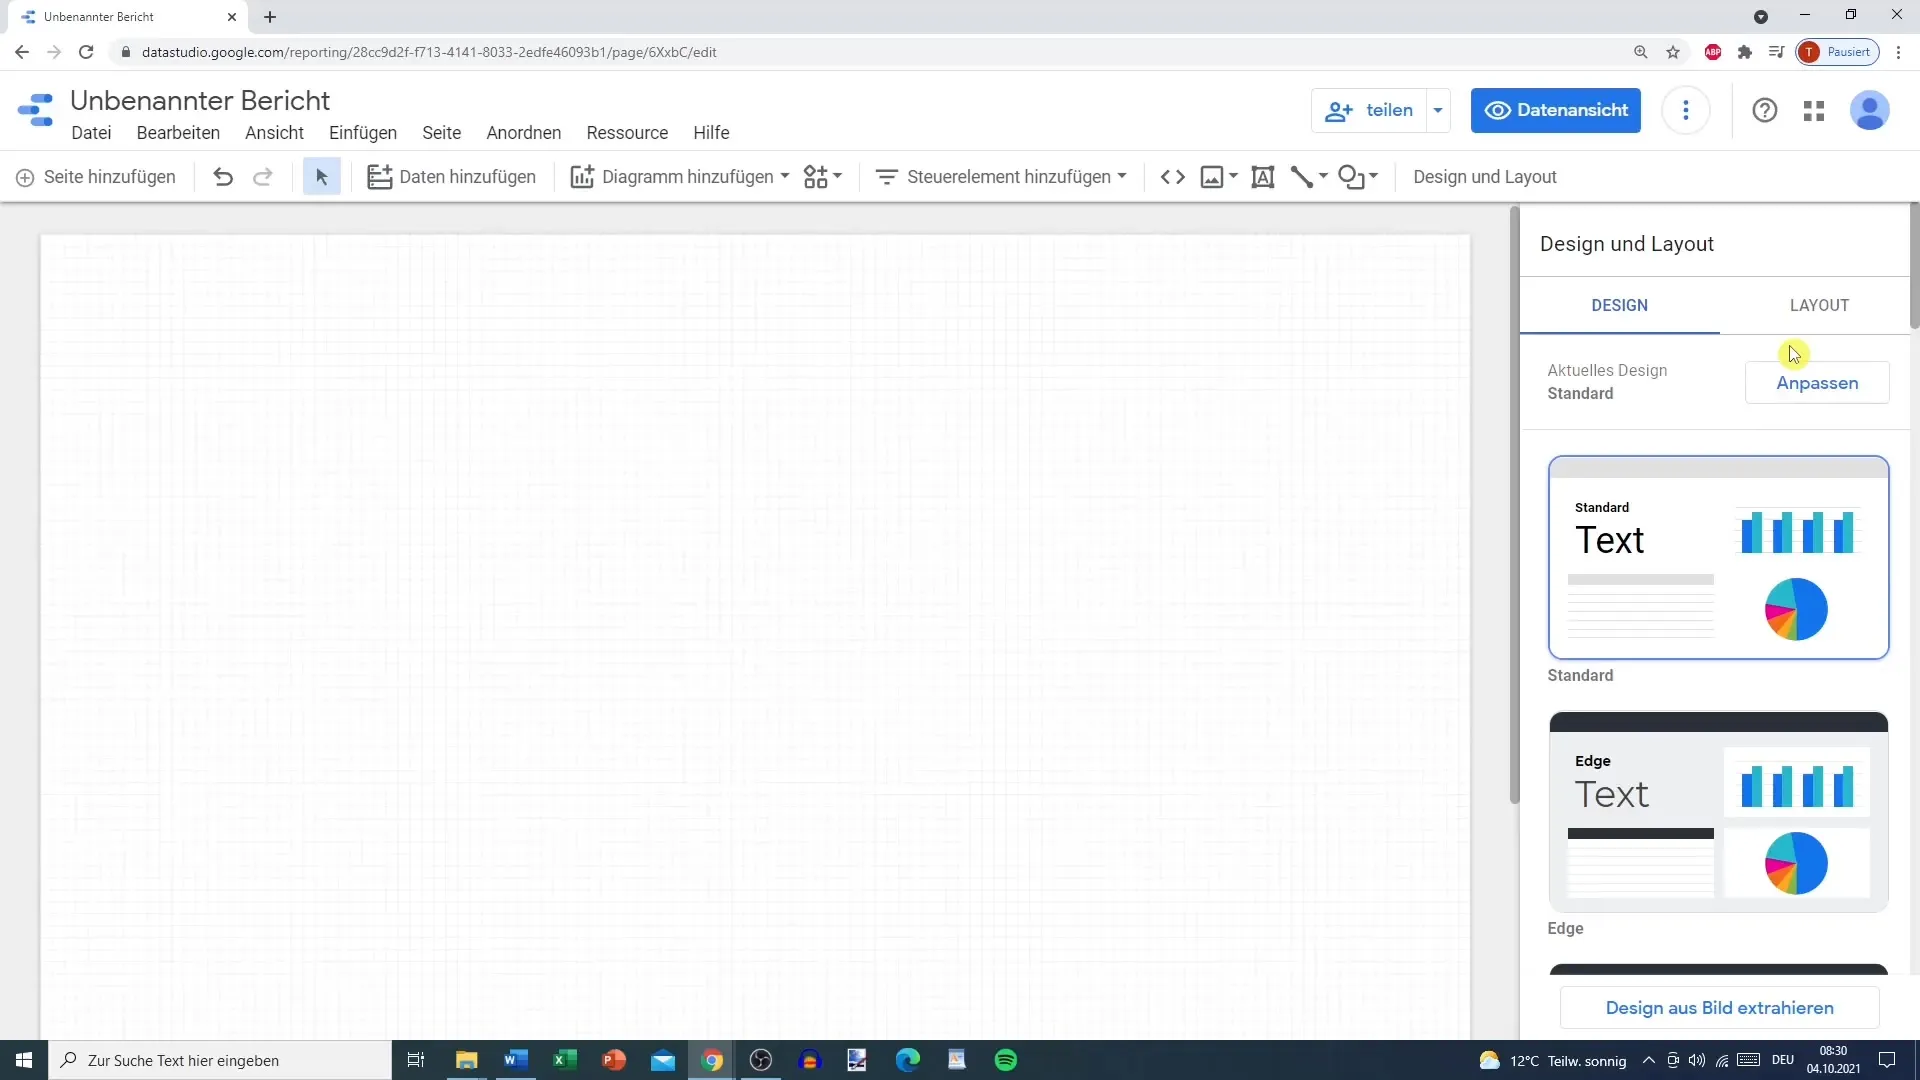
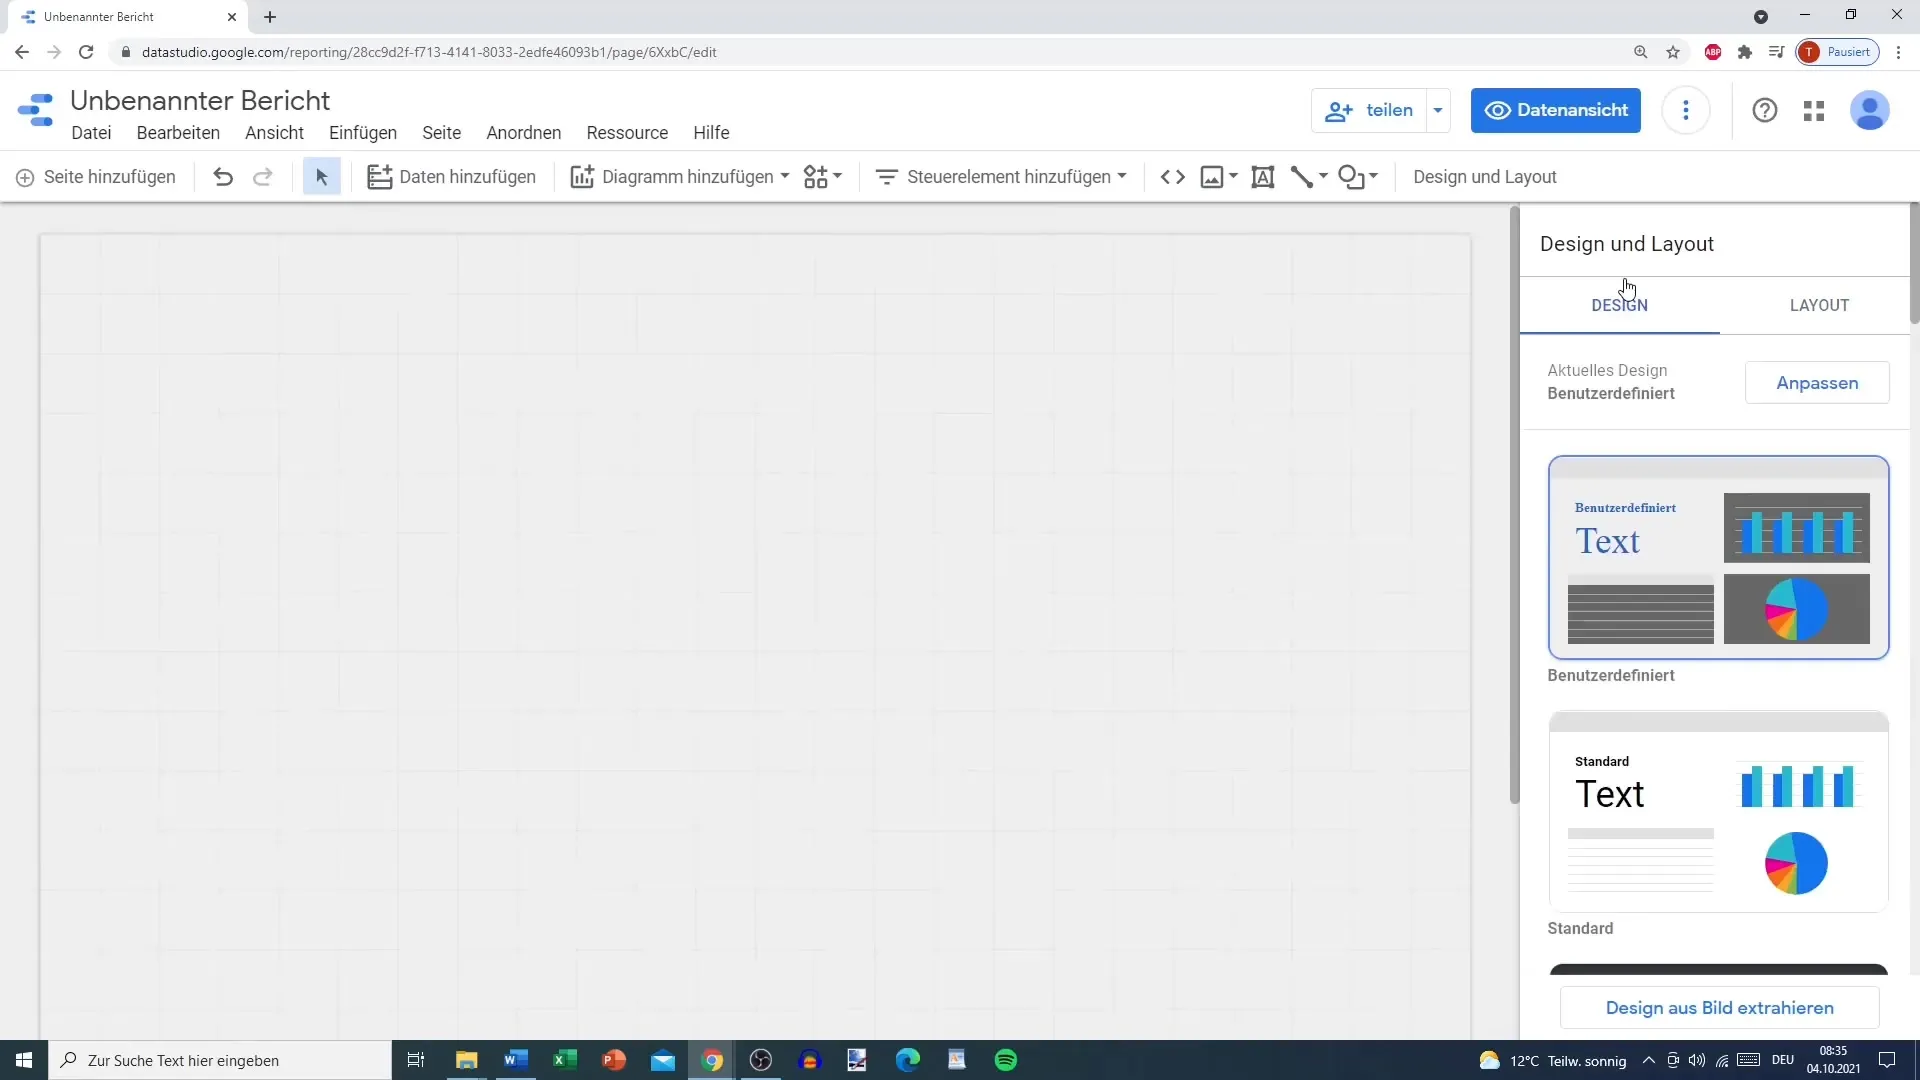
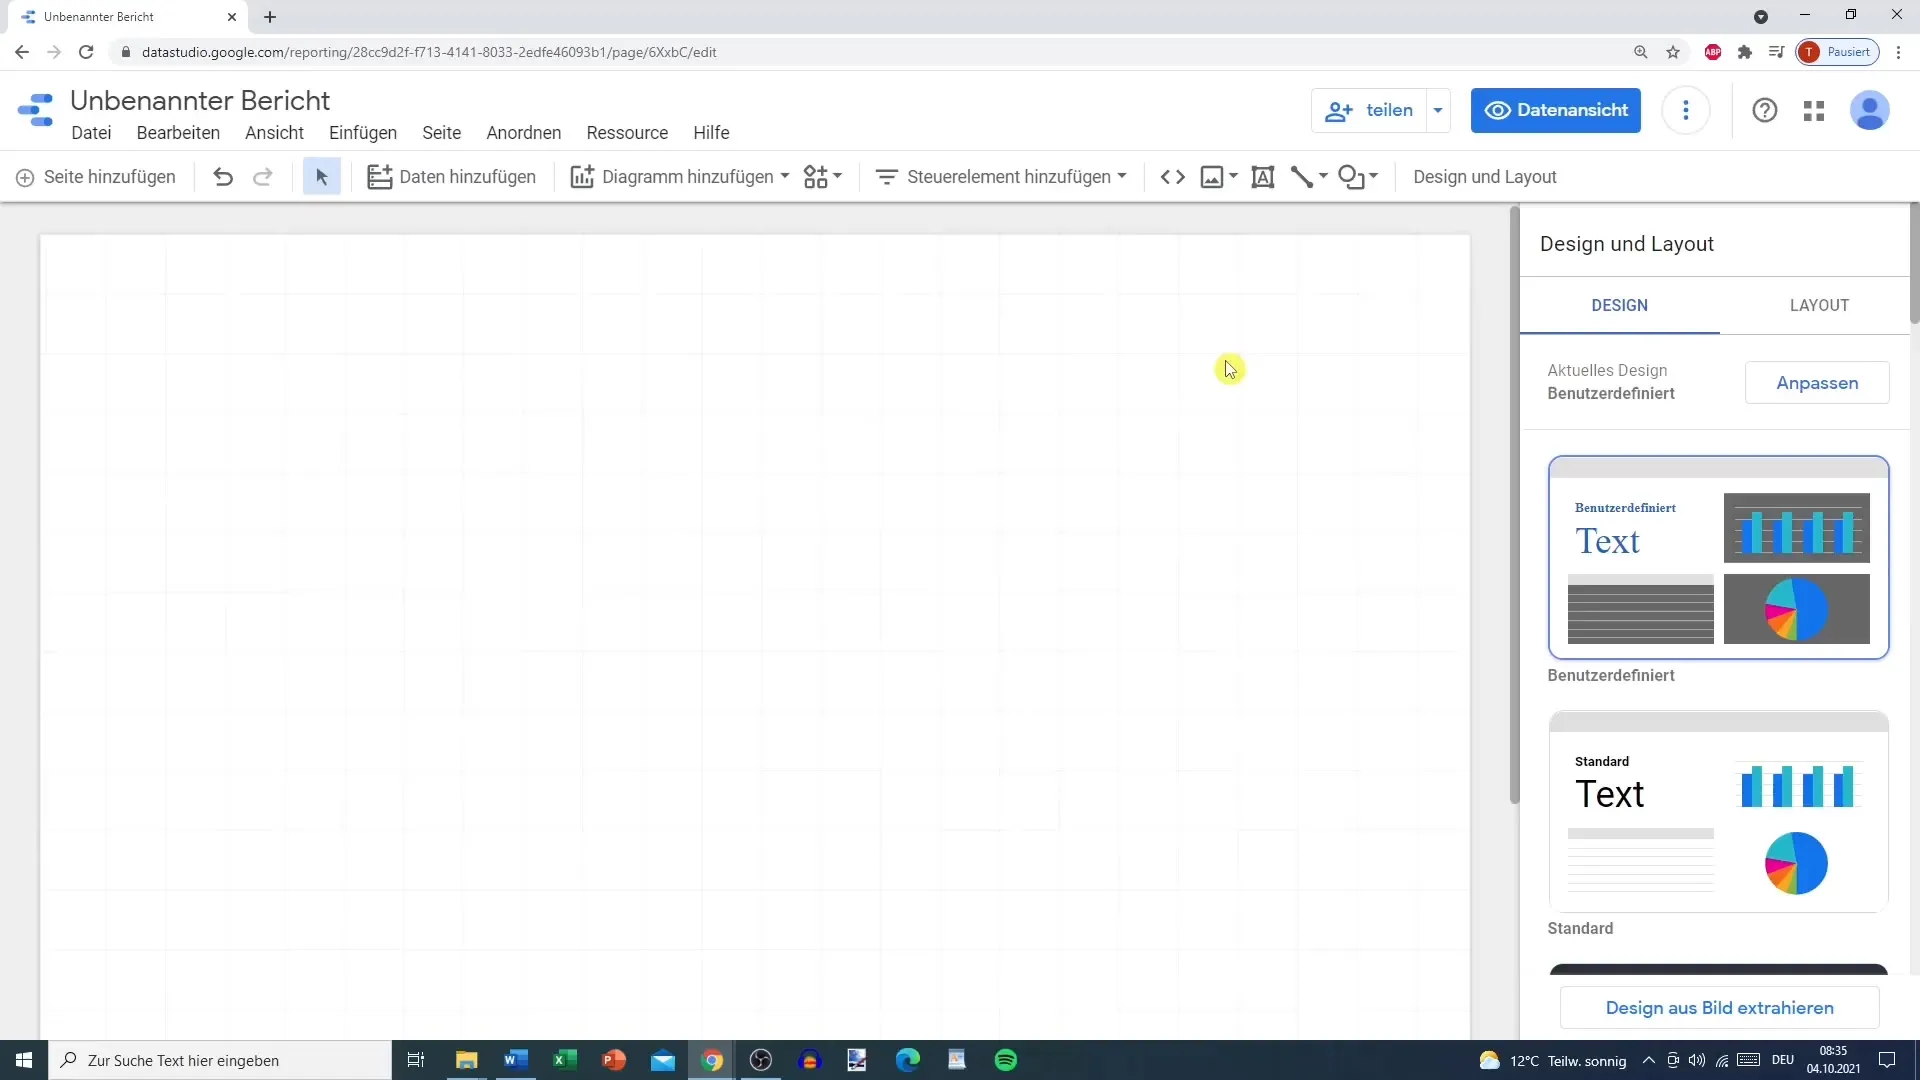
To design the layout of your report, go to the Design section. Here, you can change the size of the slides, adjust backgrounds and colors, and select fonts to give your report a unique look.
Step 5: Choose Background Color and Text Style
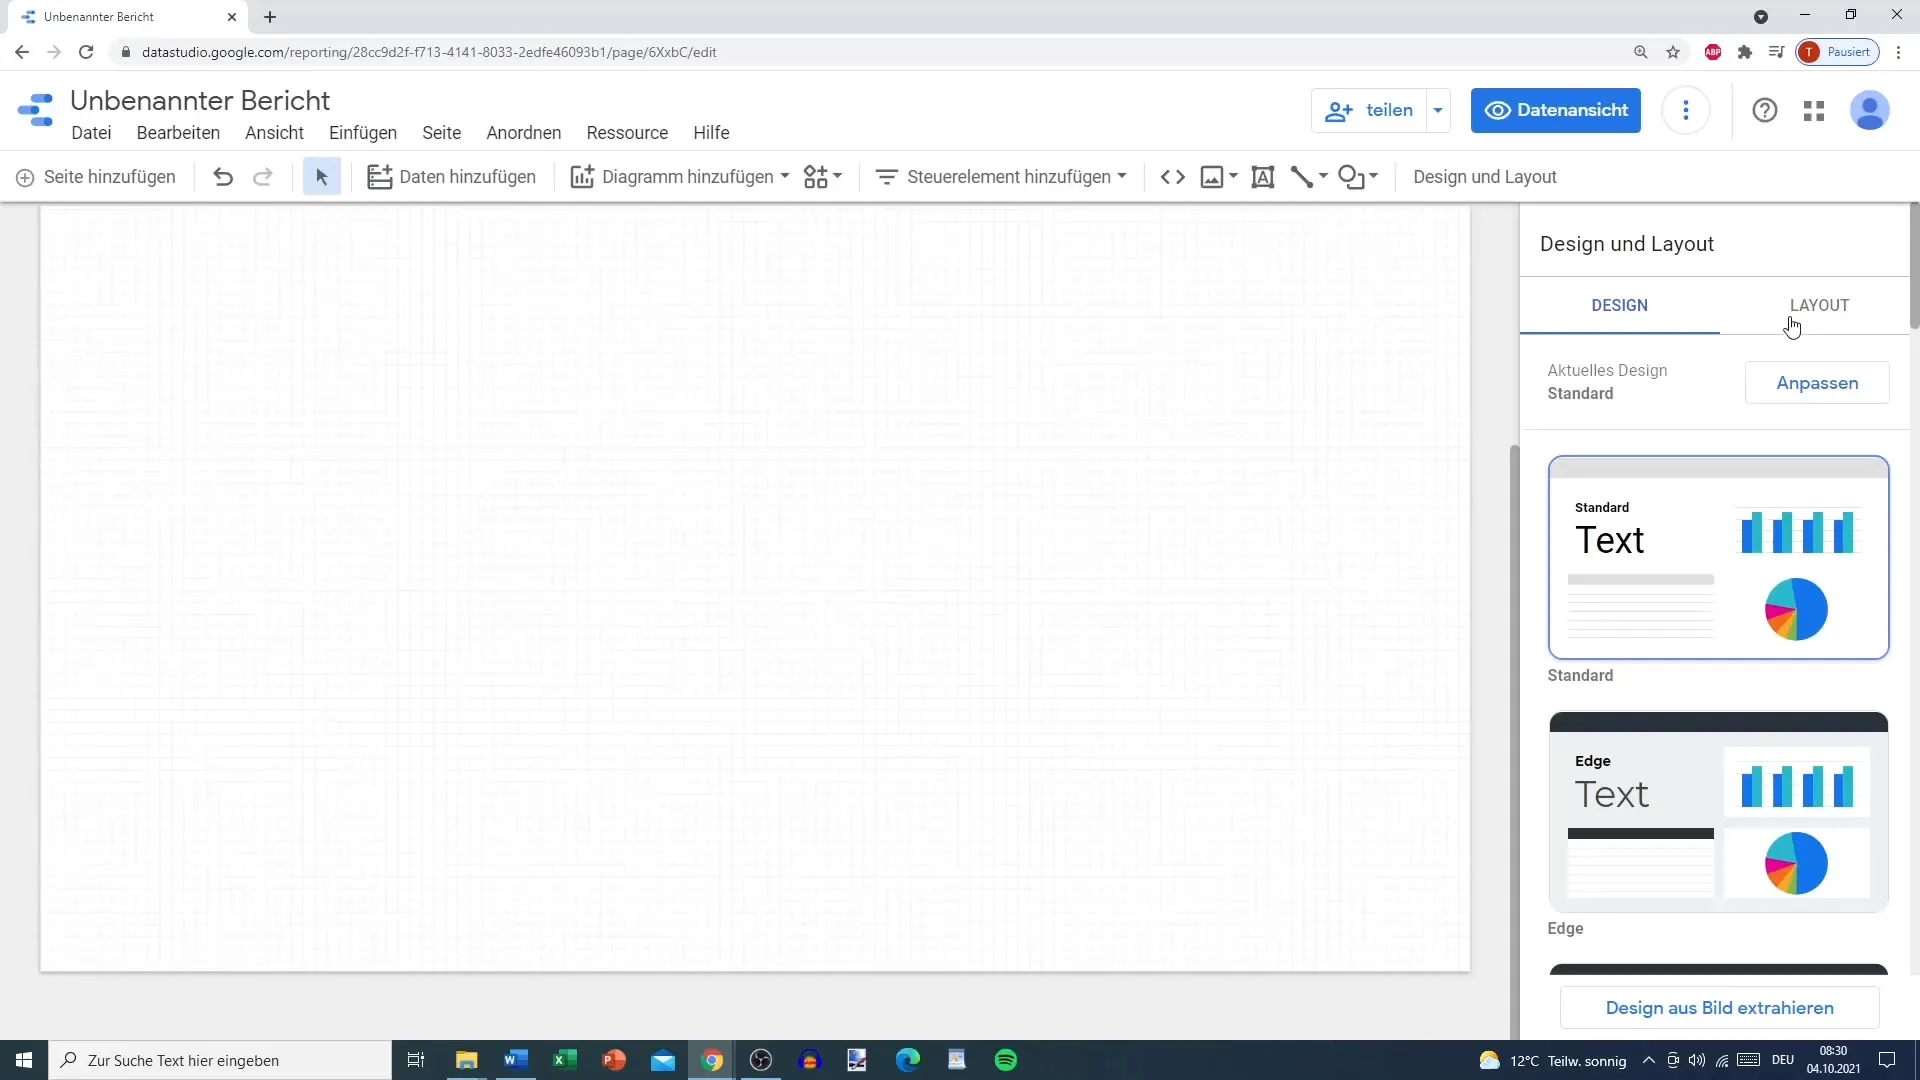
Select the background color of your slide. You can also adjust colors for text and border elements. Experiment with different options to create a harmonious overall impression.
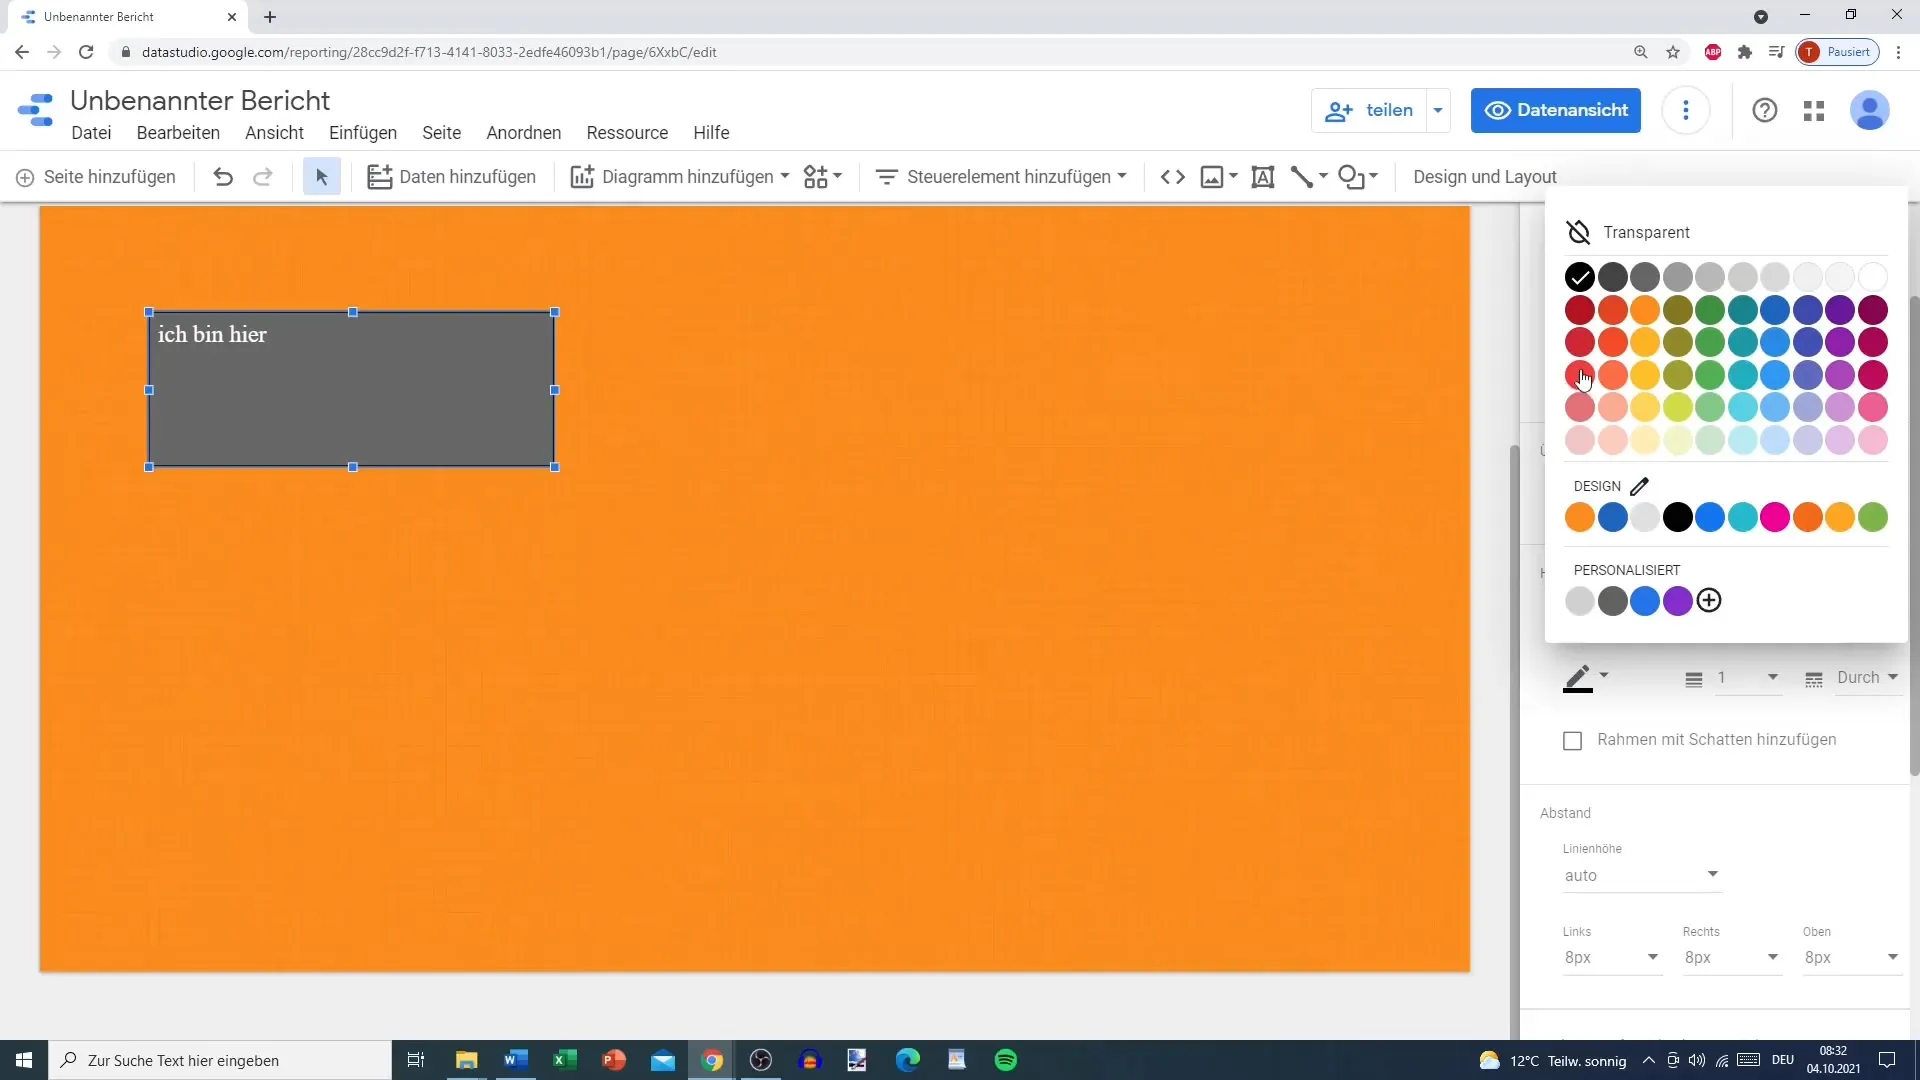
Step 6: Set Border and Background Color for Elements
You can customize each text or chart element individually. Click on the element and change the background and border color. For example, set a red border to highlight it.
Step 7: Adjust Grid and Spacing
To further refine your layout, you can adjust the grid settings. A clear structure helps readers better grasp the information. Change the grid sizes and spacing both horizontally and vertically so that the elements are well arranged.
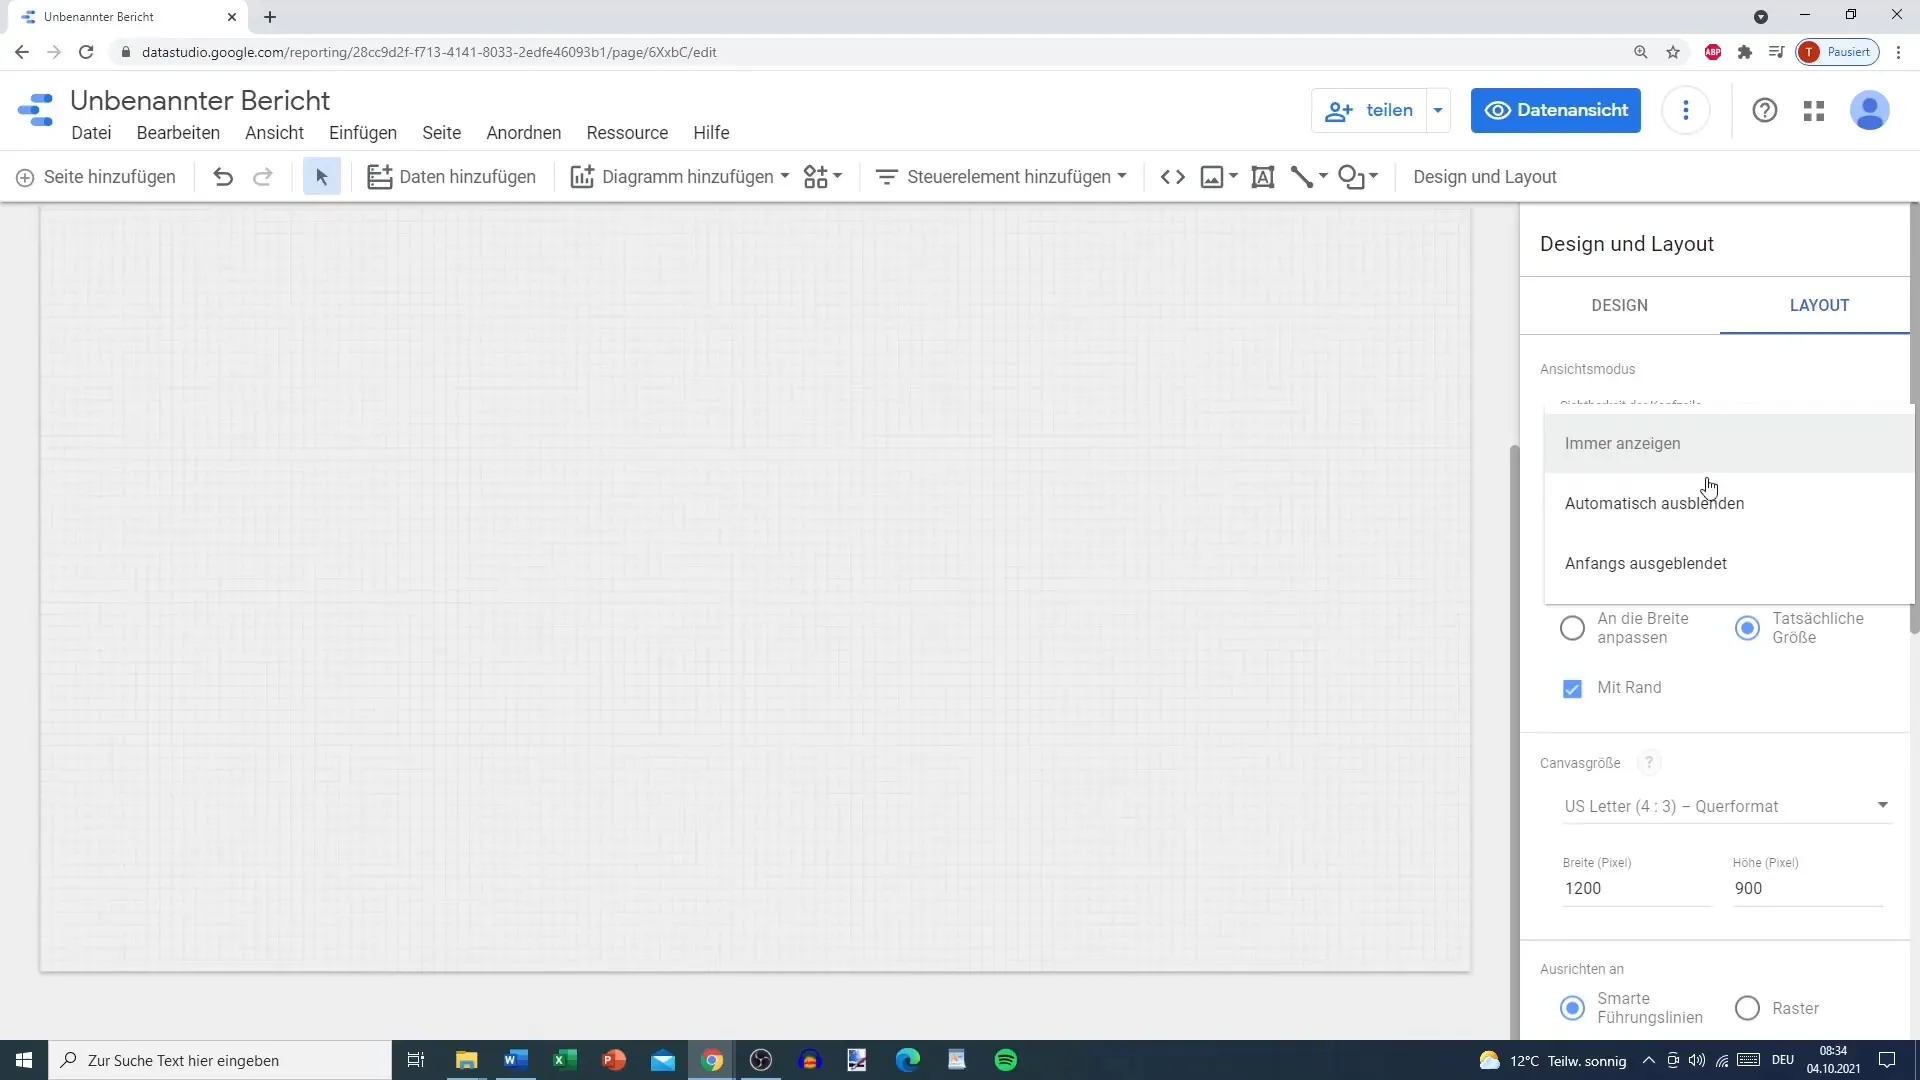
Step 8: Change Header and Navigation
In each report, you can add or disable a header. Choose the navigation type (for example, top or left) to improve the reading flow for users. This greatly contributes to the user experience.
Step 9: Insert Clear Charts
To make your report informative, add charts. Ensure that the charts are logically arranged and that the colors used fit well with the design of the report. This will make the analysis more intuitive and understandable for readers.
Summary - Google Data Studio: Layout and Design for Effective Reports
The layout and design in Google Data Studio are crucial for the success of your reports. By customizing colors, fonts, and elements, you can leave a visual impression that supports the information instead of overshadowing it. By carefully planning the structure and visual design, you create a report that is both informative and inviting.
Frequently Asked Questions
How do I connect Google Data Studio with Google Analytics?You need to click on "Add Data" and select Google Analytics from the available data sources.
Can I upload my own data sources as well?Yes, you can upload CSV or XML files to integrate your own data sources.
How do I change the colors of charts?Click on the chart to change the color settings and select the desired colors.
Do I need a Google account to use Data Studio?Yes, a Google account is required to use Google Data Studio.
Can I save and share my reports?Yes, you can save reports and easily share them with others, even in real time.
