
Microsoft Visio course: from the basics to finished diagrams and visualizations

- Visio course: Learn how to use the Microsoft application and create informative visualizations
- Effective introduction: quickly find your way around the Visio interface and Visio functions
- Understand the basic principle: How to work with templates and shapes/drawing objects
- Tips & tricks: Link Visio with Excel and Access, export results and share them with others
- Practice: How to create floor plans, organizational charts, network, BPMN, Gantt and flow diagrams
- A video tutorial lasting over four hours by Visio expert Fabio Basler
From simple sketches during a brainstorming session to sophisticated network and flowcharts: join the Visio training and get your visualizations in top form!
53 Videos, 262 minutes
Introduction to MS Visio
MS Visio course: 1.1 | How is the course structured?
In this first lesson, you will get an overview of how the Visio course is structured and what you will learn in the course. You will be shown all the important learning objectives and you will be given a structure for how to proceed in the course.
MS Visio course: 1.2 | Why use Microsoft Visio?
In this video you will learn why you should use Microsoft Visio as visualization software and what advantages the application offers.
MS Visio course: 1.3 | Visio-Start
Now let's start with Visio! We will now start the application and learn how to open, close and save Visio. I'll give you some important tips along the way.
MS Visio course: 1.4 | The user interface at a glance
How is the Visio user interface structured? In this video, I will show you how Visio is structured and which tabs are located in the application.
MS Visio course: 1.5 | Using standard templates
Visio offers us numerous templates that we can use for our applications. Let's take a look at the most important ones!
MS Visio course: 1.6 | Visio options
There are various setting options in the options dialog. Let's take a closer look at these.
MS Visio course: 1.7 | Basic concepts in Visio
Learning an application is just like learning a language. Therefore, in this lesson you will learn the most important basic terms of Visio.
The project file contains screenshots of Visio with the basic terms shown in the video.
Start and Insert
MS Visio course: 2.1 | Drawing sheets and status bar
Let's now start with drawing sheets and the Visio status bar.
MS Visio course: 2.2 | Insert illustrations
How can we insert illustrations into Visio? This will be the subject of this lesson.
MS Visio course: 2.3 | Insert shapes and diagram parts
Shapes are so-called drawing objects in Visio that help us to visualize. In this lesson, we will now begin to look at these objects.
MS Visio course: 2.4 | Insert links and texts
When inserting, it is also possible to insert text and links. You can find out how this works in practice in this video.
MS Visio course: 2.5 | Insert links to drawing sheets
We can also set links to drawing sheets. Let's take a look at this in this lesson!
MS Visio course: 2.6 | Clipboard and formatting
The clipboard can be used to copy elements and paste them back into a suitable location. There are numerous tips for this, which you will learn about in this video.
MS Visio course: 2.7 | Manage arrangements
The arrangements of drawing objects in Visio can be managed in different ways. In this video we learn all about the arrangements.
MS Visio course: 2.8 | Customize quick access
Customizing the quick access allows us to work with Visio even faster. In this lesson, you will learn all the important tips.
MS Visio Course: 2.9 | Custom Ribbon Customization
The ribbon customization can also be user-defined. You will learn how to do this in this lesson.
Edit shapes (Zeichenobjekte)
MS Visio course: 3.1 | Insert, duplicate, move, remove shapes
Let's now take a look at shapes in Visio. Here you will learn everything about inserting, duplicating and moving shapes.
MS Visio course: 3.2 | Shape categories and search
What shape categories are there and how can you search for selected shapes? That's what you'll learn in this lesson.
MS Visio course: 3.3 | Rotate and flip shapes
Shapes can also be rotated and mirrored. Let's take a closer look at this in the video.
MS Visio course: 3.4 | Grouping and positioning shapes (alignment)
If there are several shapes, they can also be arranged in groups. Here you will learn everything about grouping and positioning shapes.
MS Visio course: 3.5 | Formatting and effects
How can we format shapes and use effects? Find out all about it in the video.
MS Visio course: 3.6 | Connecting shapes
Shapes can also be connected. Let's take a look at this in the video.
MS Visio course: 3.7 | Manage labels
Labels make it possible to place texts on shapes. How do labels work in practice?
View
MS Visio course: 4.1 | Presentation mode and display options (ruler, grid, page break, guide lines)
The presentation mode enables us to present the results of our work in the drawing appropriately. Here you will learn everything about the presentation mode and the display options.
MS Visio course: 4.2 | Tasks and zoom
In this video you will learn everything about the task areas and zoom in Visio.
MS Visio course: 4.3 | Arrange windows
Basically, you can work with multiple windows in Visio. Let's take a look at the different views in this video.
MS Visio course: 4.4 | Macro and VBA
The VBA scripting language can be used to automate work processes in Visio. Here you can find out everything about simple applications with macros.
MS Visio course: 4.5 | Using VBA: Changing the color of shapes
Let's now move on to an application example in which we intelligently change the color of shapes.
MS Visio course: 4.1 | Presentation mode and display options (ruler, grid, page break, guide lines)
4 min OpenDraft and release
MS Visio course: 5.1 | Set up drawing sheet
The Design tab offers us numerous options. Let's start by setting up our drawing sheet.
MS Visio course: 5.2 | Designs and variants
Various designs and variants are available as standard, which we would like to take a closer look at in this lesson.
MS Visio course: 5.3 | Backgrounds and layouts
Let's now use backgrounds and layouts to customize our workspace.
MS Visio course: 5.4 | Print
How can work results be printed in Visio? Here you can find out everything about printing drawing sheets in Visio.
MS Visio course: 5.5 | Header and footer
The header and footer can also be managed user-defined in Visio.
MS Visio course: 5.6 | Release
How can work files be shared? Learn all about sharing files here.
MS Visio course: 5.7 | Export
Exporting drawing sheets allows us to convert Visio files into PDF files.
Data connection and interfaces
MS Visio course: 6.1 | Connect Excel workbook
Visio can be connected to different data sources. In this video, we will link an Excel file with Visio.
MS Visio course: 6.2 | Connect Access database
In this video we will link an Access database with Visio.
MS Visio course: 6.3 | Visio Data Visualizer in Excel
There are numerous add-ins in Excel - including the interface to Visio via the Visio Data Visualizer.
Verification
MS Visio course: 7.1 | Spelling and language
Spelling and language can also be managed in Visio - via the Review tab.
Organizational chart
MS Visio course: 8.1 | Create organization chart
The organization chart visualization form allows us to depict hierarchical structures in Visio. In this video, you will learn all about this form of visualization.
MS Visio course: 8.2 | Create user-defined organization chart
There are numerous configuration options when creating an organization chart, which we will look at in this lesson.
MS Visio course: 8.3 | Import/export data for organizational charts
To complete the organizational charts, we will now import and export our data.
Flowcharts
MS Visio course: 9.1 | Create flowchart
Next, we will look at the flowchart visualization form.
MS Visio course: 9.2 | Cross-functional flowchart
In addition to a simple flowchart, we can also use a cross-functional flowchart.
Network diagrams
MS Visio course: 10 | Create network diagram
Another popular form of visualization in Visio is the network diagram. Let's take a look at this diagram in this lesson.
Space plan
MS Visio course: 11.1 | Room plan overview and floor plan
Next, we will look at the room plan overview and floor plan visualization in Visio.
MS Visio course: 11.2 | Using layers
Layers allow us to make advanced use of shapes in Visio. How can you use them? You'll learn in this video!
BPMN diagrams
MS Visio course: 12 | BPMN diagrams
BPMN stands for Business Process Modeling Notation. These visualizations help us to model processes in Visio.
Customize Visio
MS Visio course: 13 | Using your own stencils
So far, we have used numerous stencils with individual shapes in Visio. It is also possible to create your own stencils. You can learn how to do this in this video.
Gantt charts
MS Visio course: 14.1 | Gantt chart
The Gantt chart or bar chart overview helps us to visualize projects appropriately. We can use this form of visualization in Visio.
MS Visio course: 14.2 | Calendar diagram
We can use the calendar diagram to model time structures. Here you can plan events and appointments precisely in the calendar.
Degree
MS Visio course: 15 | Completion
Finally, I would like to thank you for your interest in my Microsoft Visio course. I hope you were able to gain many valuable tips from the course that you can use for your projects in Visio. I wish you continued success and best regards, Fabio.
Examples of use
-
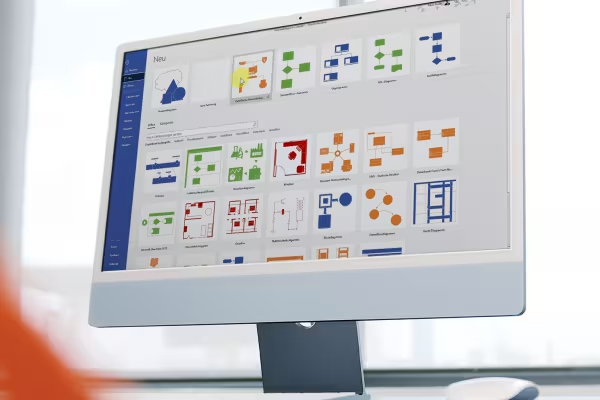 From floor plans to flowcharts - how to create eye-catching and informative visualizations with Microsoft Visio!
 -
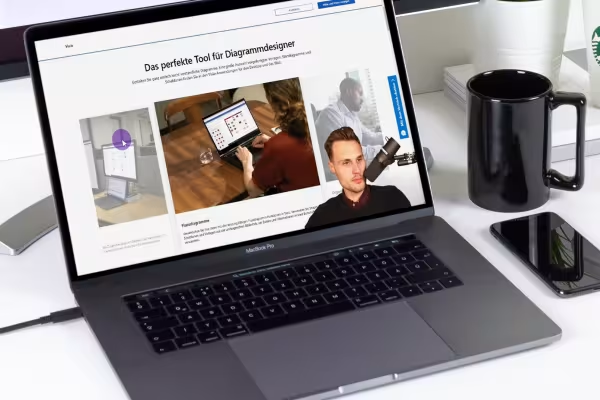 Learn the basics of Visio as well as the practical use of the software.
You might also like

Create, set up & optimize online advertising

This saves you time and effort!
Faster results in your tables
With flyer, business card & Co.
Comment now „Microsoft Visio course: from the basics to finished diagrams and visualizations“