
A dashboard only becomes truly useful when you can decide for yourself which data is displayed. This is exactly what so-called controls in Google Data Studio are for. They allow the viewer to select date ranges, filter campaigns or devices, and change metrics according to their own preferences. In this guide, I will show you step by step how to insert the most important controls, connect them to data sources, and adapt them visually to your dashboard.
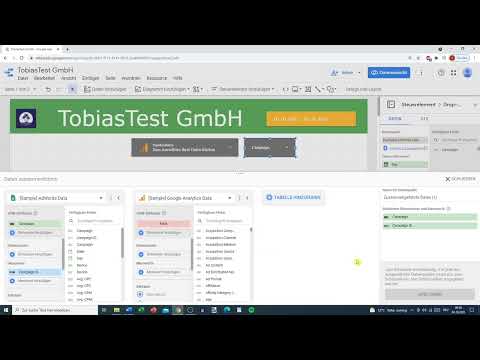
The video is only loaded from YouTube when you play it – data (including your IP address) is then transmitted to YouTube/Google. More in the privacy policy
Key Takeaways
Controls make your dashboard interactive because users can select date ranges, fields, and metrics themselves. Before you insert charts, you should place the controls and connect them to data. You can connect data sources, populate dropdown lists with dimensions, swap metrics such as conversion rate or CPC, and refine the layout using styles, transparency, and text boxes.
Step 1: Finding Controls in the Toolbar
The starting point is always the toolbar at the top of the report editor. There you will find the Controls section, from which you can insert all available options. Take a good look at the selection, because you will use several of them over the course of this guide.

Step 2: Inserting and Testing the Date Range Control
The date range control is probably the most common control. Insert it at the top of your report. Then switch to view mode by clicking the corresponding switch at the top right. There, a user can click directly on the date and select a different date range.
As long as no data is connected yet, the display remains unchanged. This is normal and not an error. The function itself is already working in the background anyway.

Step 3: Adding the Data Control and Connecting a Data Source
Now you need a data source. To do this, click on the data control and, in the window that opens, select the appropriate connector. In this example, Google Analytics is used because the account is already connected. If your data comes from Google Ads, you choose the Google Ads connector instead.
Confirm the selection and follow the instructions for authorization. Only then are the source's views and fields available to you.

Step 4: Customizing the Style of the Control
Once the control is inserted, you can give it a suitable appearance using the style settings. Choose a style, move the element to the desired position, and align it neatly with the edge or with other elements. A consistent layout looks significantly more professional to the viewer.
You can also give the control a border. This visually sets it apart from the charts and makes it immediately clear that it is an interactive element.

Step 5: Selecting Multiple Properties and Views
In view mode, the arrow in the control lets you switch between different properties and data views. A property can contain several views, such as a raw data view, a master view, and a test view.
This is especially helpful if you want to separate data by country or device type. A user can then decide for themselves whether they want to look at only desktop users or only mobile users.

Step 6: Connecting Google Ads and Selecting Campaigns
Besides Google Analytics, you can also connect Google Ads as a data source. After authorization, you can select individual campaigns in view mode and thus analyze specifically which ads deliver which results. With multiple campaigns in the account, this comparison is particularly easy to follow.
Incidentally, Google Analytics and YouTube Analytics can be integrated in the same way. The principle always stays the same.
Step 7: Inserting a Dropdown List and Populating It with Data
A dropdown list is another useful control. Insert it and first format it in terms of style before you connect it to data. Adjust the size and font size so that it remains easy to read.
When you open the data source of the list, you see all available fields. In this example, it is sample data from Google Ads. You can also add a second data source and combine both sources with each other. This way, data from different sources is available to you in a single report.

Step 8: Adjust dimensions and metrics via drag and drop
In the control field, you determine which dimension is displayed. To do this, open the available fields and look for the desired dimension, for example Campaigns or Devices. Simply drag the field into the control field using drag and drop.

If you instead drag a metric into the field, such as the conversion rate, the values are displayed with matching numbers. Devices such as tablet, computer, or mobile phone then appear with the corresponding values. This way, you can immediately see where the results are particularly good or bad.
Step 9: Swap metrics and refine the display
You don't have to commit to a single metric. Simply replace the conversion rate with other metrics such as CPC, the average CPC, or clicks. Drag the new metric onto the existing field, and the display adjusts automatically.
In the settings, you can also set the number of decimal places. By default, the setting usually remains automatic. In addition, values can be displayed or compact numbers can be activated, so that large numbers appear more clearly.

Step 10: Style the table visually
A table quickly looks cluttered if it remains unformatted. Therefore, choose a suitable color scheme and copy the field if necessary to quickly create similar elements. With the background, you can make the table visually stand out or recede.
A trick from practice: Slightly reduce the transparency of the color, for example to 50 to 60 percent. The difference is small at first, but overall it looks significantly more balanced.

Step 11: Add text fields
With a text field, you can label your control element. Insert it, write a short instruction such as "Please select:" in it, and color the text black if needed. Increase the font size so that the note is easy to read.

Then you move the entire element to the appropriate place. This can be a bit tedious, as elements can easily change unintentionally when moved. If you click on or select something wrong, you can undo the step and try again. This happens to experienced users as well.
Summary ??? Interactive controls in Google Data Studio
With the controls in Google Data Studio, you make your report flexible and user-friendly. You have learned how to insert date range controls and data controls, connect Google Analytics and Google Ads, populate dropdown lists with dimensions, and adjust metrics. You have also seen how to create a coherent layout with styles, borders, transparency, and text fields.
The next step is about charts. With them, you visualize your data and can build the dashboard completely. This is exactly where the particular strength of Google Data Studio lies: You can design reports that can be adapted to different questions without much effort.
FAQ
What is a control element in Google Data Studio?A control element is an interactive element with which users can filter or adjust data in the report, for example a date range, a dimension, or a metric.
How do I add a date range control?You can find the date range control in the toolbar under Controls. Insert it into the report and then test it in the data view.
Why does nothing change after inserting a date range control?As long as no data is connected yet, there is nothing that could change. First connect a data source, then the control element will show the desired effects.
Which data sources can I connect to the data control?You can connect Google Analytics, Google Ads, or YouTube Analytics, for example. To do so, select the appropriate connector in the data control window.
Can I combine multiple data sources?Yes, you can add a second data source and link both sources with each other. This way, you can analyze data from different systems in one report.
How do I change a metric in a control field?Drag the desired metric, such as CPC or clicks, onto the existing field. The display then adjusts automatically.
How do I improve the readability of my dashboard?Use consistent styles, sensible spacing, subtle colors, and text fields with clear labels. Reduced transparency can also make tables look more balanced.


