
Imagine you open your report and can see at a glance which campaign brings conversions and where your costs are exploding. That is exactly what data visualization in Google Data Studio makes possible. In this guide, I will show you step by step how to add charts, design them, and equip them with comparison values.
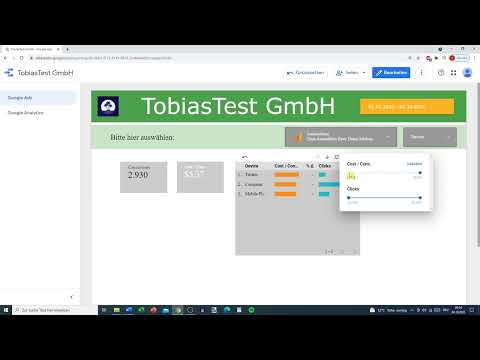
The video is only loaded from YouTube when you play it – data (including your IP address) is then transmitted to YouTube/Google. More in the privacy policy
Introduction
Data visualization means preparing numbers so that you understand them immediately. Google Data Studio is very well suited for this, because you can link charts directly to your data sources and adjust them with just a few clicks. You don't need any programming skills, but you should have a basic understanding of metrics such as clicks, conversions, or cost per conversion. The process is based on an example with Google Ads data, which you can easily transfer to your own data.
Key Takeaways
Charts are inserted via "Add a chart" and can be adjusted at any time via the settings for data, style, and breakdown. Metrics and dimensions determine what is displayed. Comparison periods and comparison values with arrows show you developments. Colors, line weights, and labels make a report readable. A good presentation depends on choosing the chart type that suits your data.
Step 1: Prepare the Data Source
Before you can draw anything, you need data. To do this, select a suitable data source via the connector. In the example, the "Data sources" area is used to add a source such as world population or your own Google Ads data. Make sure the date range at the top of the report is correct, as it affects all charts.

Step 2: Insert a Chart
Go to the menu bar and click "Add a chart". Alternatively, you can find the charts under "Insert". There you will find scorecards, bar charts, time series, tables, and much more. Scorecards are a good way to start, because they only display one central value with a title.

Step 3: Create a Scorecard and Adjust the Design
Select the scorecard and place it in the report. It consists of a small field with a title and a number. In the "Style" tab, you can change text size and colors. If you don't want to repeat the setting for every new element, it is worth defining the colors once in the general report settings. There you can, for example, set a light gray background that visually separates the fields from the report area.

Step 4: Define the Data Source and Metrics
Each scorecard shows the values of one data source. In the example, the "AdWords data" source is used first. If you want to combine several sources, you can add and save a new data source. The data is then merged. In the metrics area, you select what should be displayed, such as clicks, conversions, costs, or cost per conversion. You can replace the metric with another one or display several at the same time. Via the format menu, you can also set whether numbers appear as whole values.

Step 5: Create Tables with Dimensions
Tables are suitable when you want to break down values by category. Add a table and drag a dimension such as "Device" into the dimensions area. The devices Computer, Tablet, and Mobile phone then appear as rows. As a metric, you can use, for example, cost per conversion and add further values such as clicks. To make the table more readable, you can adjust font size, font color, and metric color, for example orange for the most important column.


Step 6: Use Drill-Down and Sorting
With the "Drill down" area, you can add levels to the table. This way you switch from device to campaign ID without having to create a second table. You should hide cryptic campaign names if they make things confusing. In the style area, you can also add sliders, set rows per page, and set the sorting to descending. Then the largest values, such as costs, are at the top.

Step 7: Set Up Comparison Periods
A comparison makes developments visible. In the "Default date range" section, select the "Custom" option and define a comparison period, such as the previous period or the previous year. Make sure that data actually exists for the comparison period. If it is missing, the comparison remains empty. If that is the case, use a different time period or a different data source.

Step 8: Set Filters and Value Ranges
With filters, you control which rows are displayed. For example, you can display only campaigns whose cost per conversion falls within a certain range. A slider for the value range lets you set limits such as 525 to 553. Here, too, the same applies: after each change, check whether the results still make sense.


Step 9: Create a Time Series and Line Chart
A time series shows values over time. Shrink it if necessary so that enough space remains for other elements. Then you add a line chart and select the metrics Conversions and Cost per Conversion. A second metric such as the average CPC can complement the display. However, when the orders of magnitude differ greatly, a metric quickly appears invisible because it shrinks to almost zero in the chart. In that case, it makes more sense to combine only comparable values or to create a separate trend chart.

Step 10: Style Lines, Bars, and Colors
In the Style section, you can switch between line and bar, change line thickness, and set colors for each series. The conversion rate, for example, gets red, the average CPC green. Bars are suitable for values that accumulate over time. To do this, enable the "cumulative" option. Data labels show the exact values directly in the chart. Use colors deliberately so that they do not look overloaded.


Step 11: Create a Pie Chart for Proportions
Pie charts are suitable when you want to show proportions, such as what share of users is accounted for by computers, mobile phones, or tablets. Add the chart, enlarge it, and select a dimension such as Devices. Since pie charts quickly become confusing, use high-contrast colors so that you can easily distinguish the proportions from one another.

Step 12: Display Comparison Values with Color-Coded Arrows
Scorecards show an arrow and a percentage in the comparison. A rising arrow does not automatically mean something good. For clicks, an increase is positive, whereas for cost per conversion it is negative. Therefore, specify in the Style section that a decrease in costs appears green and an increase appears red. This way, the viewer recognizes the assessment at first glance.


Step 13: Add Special Charts and Text Fields
Scatter charts show two metrics plotted against each other, such as conversions on the x-axis and cost per conversion on the y-axis. The bubble size can represent clicks. For geographic analyses, there are Google Maps charts that color regions differently depending on the value. Pivot tables and heatmap-style tables show values through color levels. So that the viewer understands what a number means, add text fields. Place a rectangle beneath the text, color it orange, for example, and arrange it in the background. This creates a clearly recognizable note, such as "Conversions:" next to a number.


Summary ??? Creating Charts in Google Data Studio Correctly
You have seen that Google Data Studio offers many ways to present data clearly. You start with a suitable data source, add charts via "Add a chart," and select metrics and dimensions. With comparison periods, filters, and color-coded comparison values, you gain insights that raw numbers cannot provide. Pay attention to colors, labels, and the choice of chart type so that your report remains quickly understandable for others as well.
FAQ
How do I add a new chart?Click "Add a chart" at the top or use the "Insert" area, select the desired chart type, and click on the area in the report.
Why are some values not displayed in my line chart?If metrics have very different orders of magnitude, a small value can be barely visible in the chart. In that case, combine only comparable values or create a separate chart.
How can I tell whether a comparison value is good or bad?For clicks, an increase is positive; for cost per conversion, a decrease is positive. Set the colors accordingly in the Style area.
Why don't I see a comparison in my scorecard?There is probably no data available for the selected comparison period. Choose a different period or a data source that contains data for this period.
How do I display values in a table by device?Add a table, select the "Device" dimension, and drag in the desired metrics such as cost per conversion or clicks.
How can I split campaigns into levels in a table?Use the "Drill down" area to add further dimensions such as the campaign ID as a subordinate level.


