
Statistics with Excel - learn and practice in practice

- Statistics with Excel using three practical case studies
- Practical learning and practicing: point system for learning control, collection of formulas, raw data and solutions
- Descriptive and inductive statistical methods examined in detail in over 4.5 hours by Fabio Basler
- Among other things: Time series, forecasts, distribution tests, mean and dispersion, normal distribution test
Data sets with dozens of parameters and hundreds of values? With this training, you can manage them and draw valuable insights from them ... get started right away.
27 Videos, 276 minutes
Introduction
Statistics with Excel: 1.1 What to expect
2 minIntroduction to the case study
Statistics with Excel: 1.2 Introduction Case Study Collection
7 minThis collection of case studies serves as an exercise and consolidation of the main areas of descriptive and inductive statistics. The collection consists of the three individual case studies (1) portfolio management, (2) automotive suppliers and (3) biotechnology. The statistics modules in the case studies can be deepened in a targeted manner using practical data.
Case Study Portfolio Management
Statistics with Excel: 2.1 Introduction to the portfolio management case study
6 minPortfolio management case study
Statistics with Excel: 2.2 Mean value analysis in Excel
8 minPerforming a mean value calculation in Excel
Statistics with Excel: 2.3 Scatter analysis in Excel
11 minCarrying out a spread ratio analysis in Excel
Statistics with Excel: 2.4 Correlation analysis in Excel (Part 1)
8 minCalculation of Pearson's correlation coefficient in Excel Part 1
Statistics with Excel: 2.5 Correlation analysis in Excel (Part 2)
5 minCalculation of Pearson's correlation coefficient in Excel Part 2
Statistics with Excel: 2.6 Rank correlation analysis in Excel
11 minCalculation of the rank correlation according to Spearman in Excel
Statistics with Excel: 2.7 Boxplot analysis in Excel
9 minGraphical visualization of a box chart in Excel
Statistics with Excel: 2.8 Data classification and frequency analysis in Excel
12 minClassification of data and quantification of frequencies in interval limits
Statistics with Excel: 2.9 Regression analysis in Excel
19 minImplementation of a linear functional relationship using multiple regression
Statistics with Excel: 2.10 Chi-square fit test for normal distribution in Excel
20 minTest for normal distribution using the chi-square goodness-of-fit test
Case study automotive supplier
Statistics with Excel: 3.1 Introduction to the automotive supplier case study
5 minAutomotive supplier case study
Statistics with Excel: 3.2 Visualization of the time series in Excel
5 minGraphical visualization of a time series in Excel
Statistics with Excel: 3.3 Determining the trend function and forecast estimation in Excel
12 minTrend estimates based on forecasts
Statistics with Excel: 3.4 Determining trends after exponential smoothing in Excel
11 minTrend estimation using the exponential smoothing method in Excel
Statistics with Excel: 3.5 Error analysis and quality estimation in Excel
11 minUse of time series analysis methods
Statistics with Excel: 3.6 Contingency analysis in Excel
24 minCalculation of correlations in Excel using two-dimensional frequencies
Case study biotechnology
Statistics with Excel: 4.1 Introduction to the biotechnology case study
8 minBiotechnology case study
Statistics with Excel: 4.2 1-SP test for the expected value with known variance in Excel
16 min1-SP test for the expected value with known variance in Excel
Statistics with Excel: 4.3 1-SP test for the proportion value in Excel
13 min1-SP test for the proportional value in Excel
Statistics with Excel: 4.4 1-SP test for the expected value with unknown variance in Excel
10 min1-SP test for the expected value with unknown variance in Excel
Statistics with Excel: 4.5 1-SP test for variance in Excel
10 min1-SP test for the variance in Excel
Statistics with Excel: 4.6 Two-sample t-test in Excel
13 minTwo-sample t-test in Excel
Statistics with Excel: 4.7 2-SP test for the difference between two proportion values in Excel
9 min2-SP test for the difference between two proportion values in Excel
Statistics with Excel: 4.8 Two-sample F-test in Excel
10 minTwo-sample F-test in Excel
Outro
Statistics with Excel: 5 Outro
2 minSummary
You might also like

7 template sets in 4 design lines – A4 PDF with crop marks, plotter SVG, JPG/PNG, PPTX, DOCX and XLSX

5 sets of 20 layer styles each · ASL and editable PSD samples

48 editable chart templates in SVG, PDF, EPS, PNG, and PowerPoint – in under a minute in the customer’s corporate identity
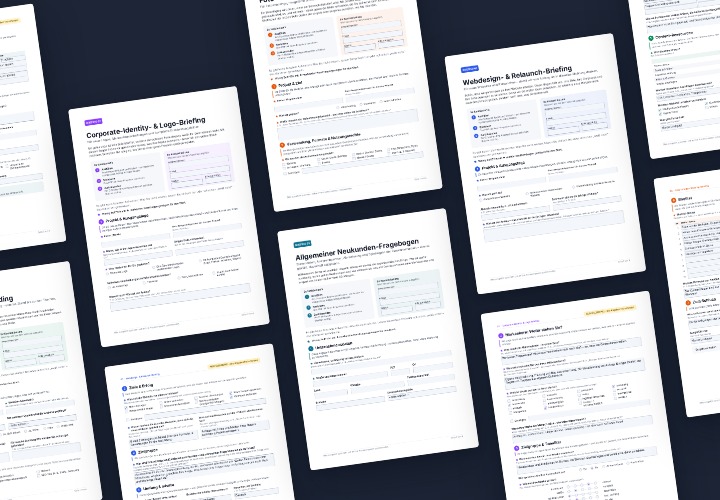
5 sheets of 4 A4 pages each as a fillable PDF – with filling examples and a guide for Acrobat and InDesign
Comment now „Statistics with Excel - learn and practice in practice“