Do you want to know if the AI can serve you as a financial advisor? This article explains in detail how you can use the powerful research feature of Claudeto conduct a comprehensive analysis of the BASFstock. We will transform screenshots into interactive graphics and show you how to use Claude as the ultimate analysis tool for complex financial decisions.
Key Insights
- Using AI for in-depth financial analysis can support your decisions.
- Claude searches more than 400 sources to obtain an accurate picture of the current market situation and the risks involved.
- The interactive graphic on dividends allows for a clear analysis of returns over time.
Step-by-Step Guide to Analyzing BASF Stock
Step 1: Requesting the Research
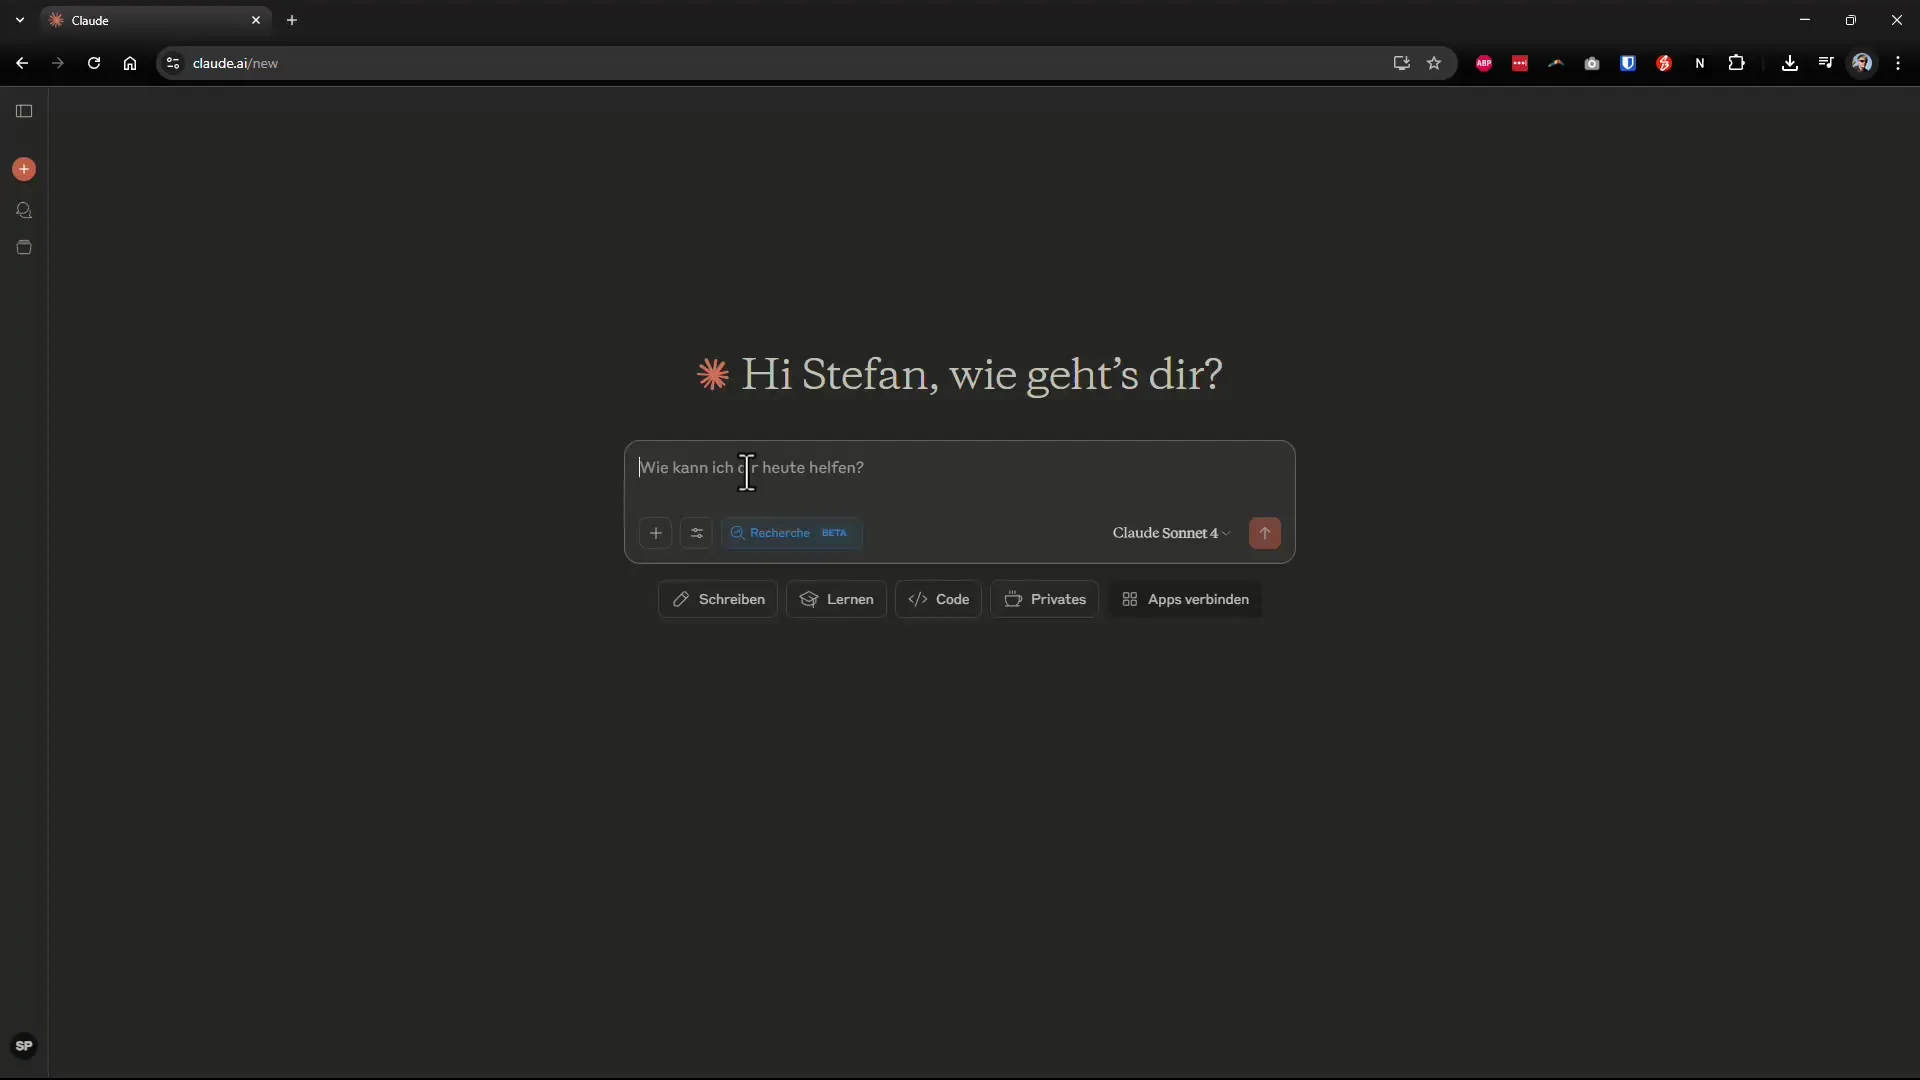
Start by asking Claude to conduct an in-depth research on the BASF stock. To do this, press the research button. Note that this is currently still in beta, but it is already very effective for your purposes. A screenshot of this first step will help you visualize the process.
Step 2: Inputting Your Requirements
Formulate your request precisely. State that you want a recommendation on the BASF stock and include your financial background. You want to know if now is a good time to enter the stock. This specific input is crucial for the AI to provide targeted responses. Here you can see how to describe your individual situation.
Step 3: Analyzing the Research Results
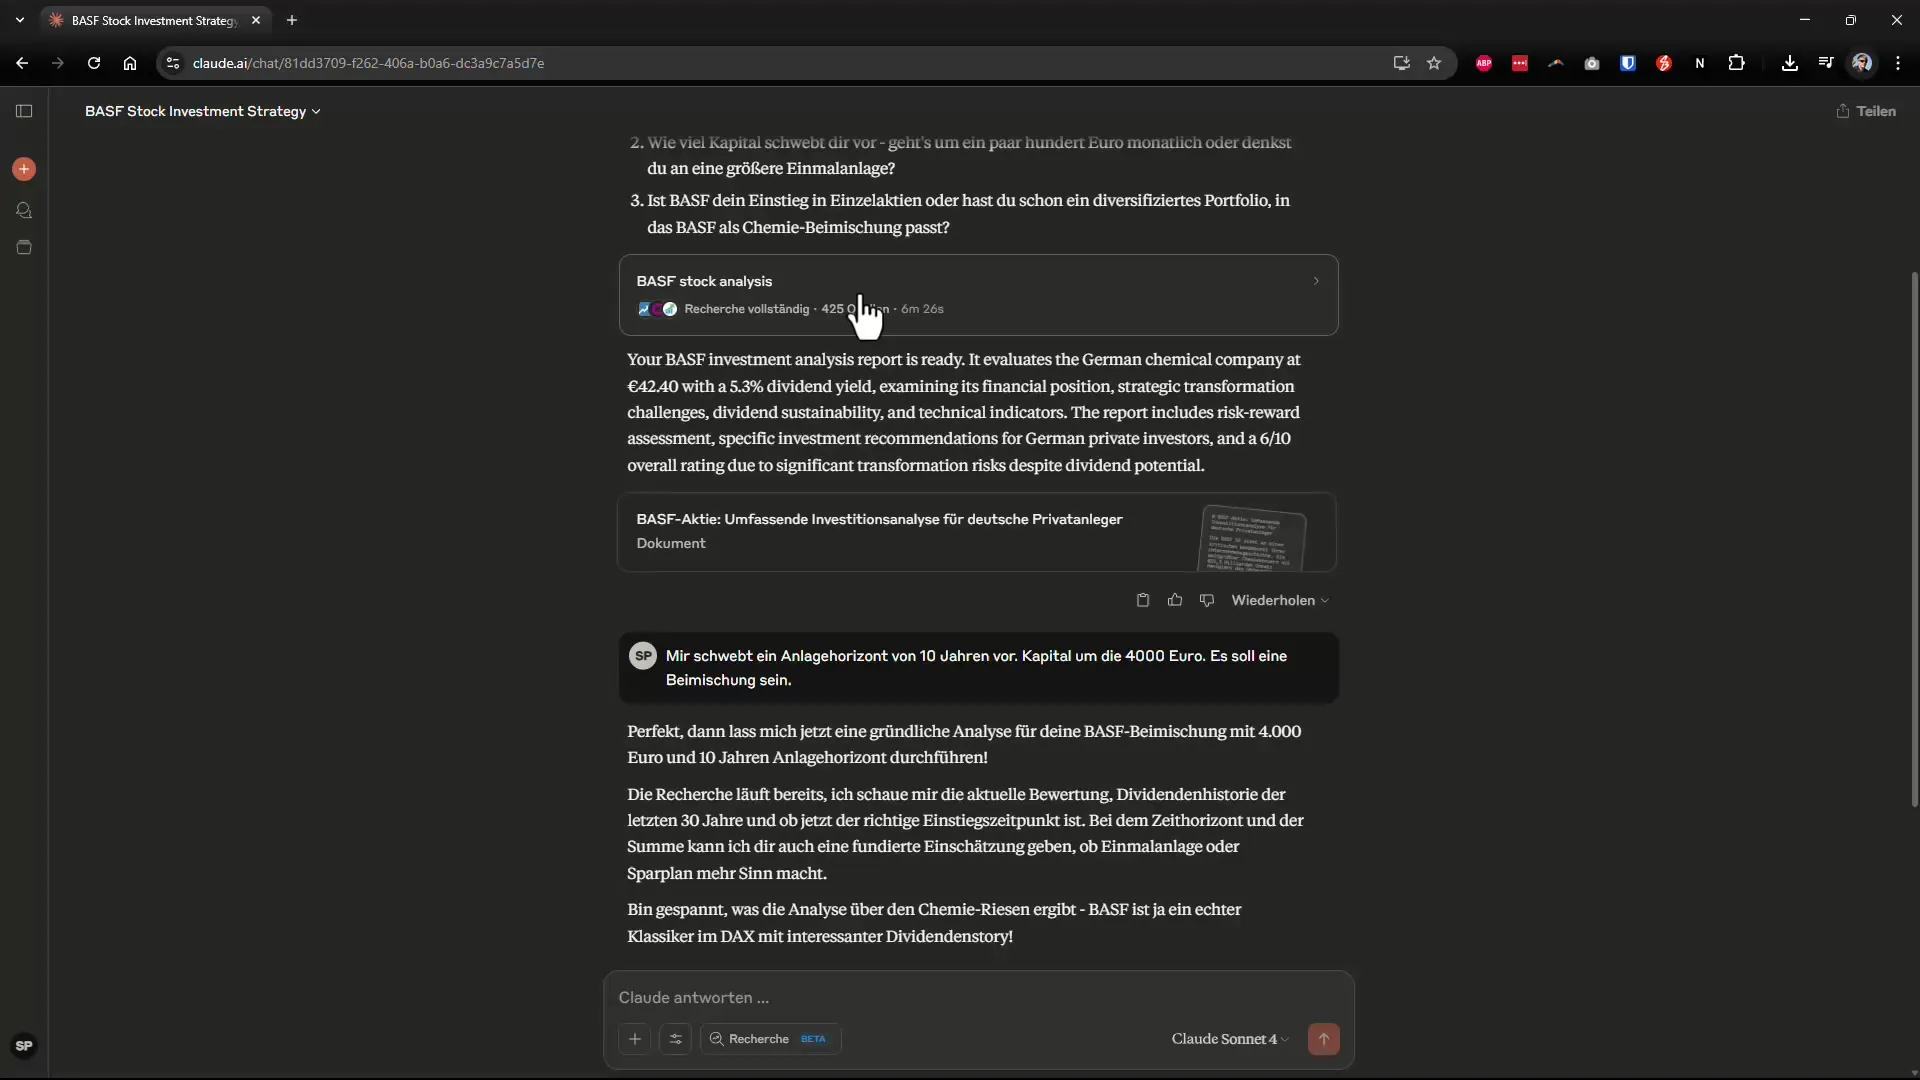
Once the research is complete, Claude will show you the collected data. You will be surprised by the number of sources – in this case, over 400. You can view the individual sources by clicking on the corresponding links. Make sure to go through all the information, especially the conclusion of the analysis, as it provides you with an overview. The screenshot shows you the summary of the research results.
Step 4: Evaluating the Recommendation
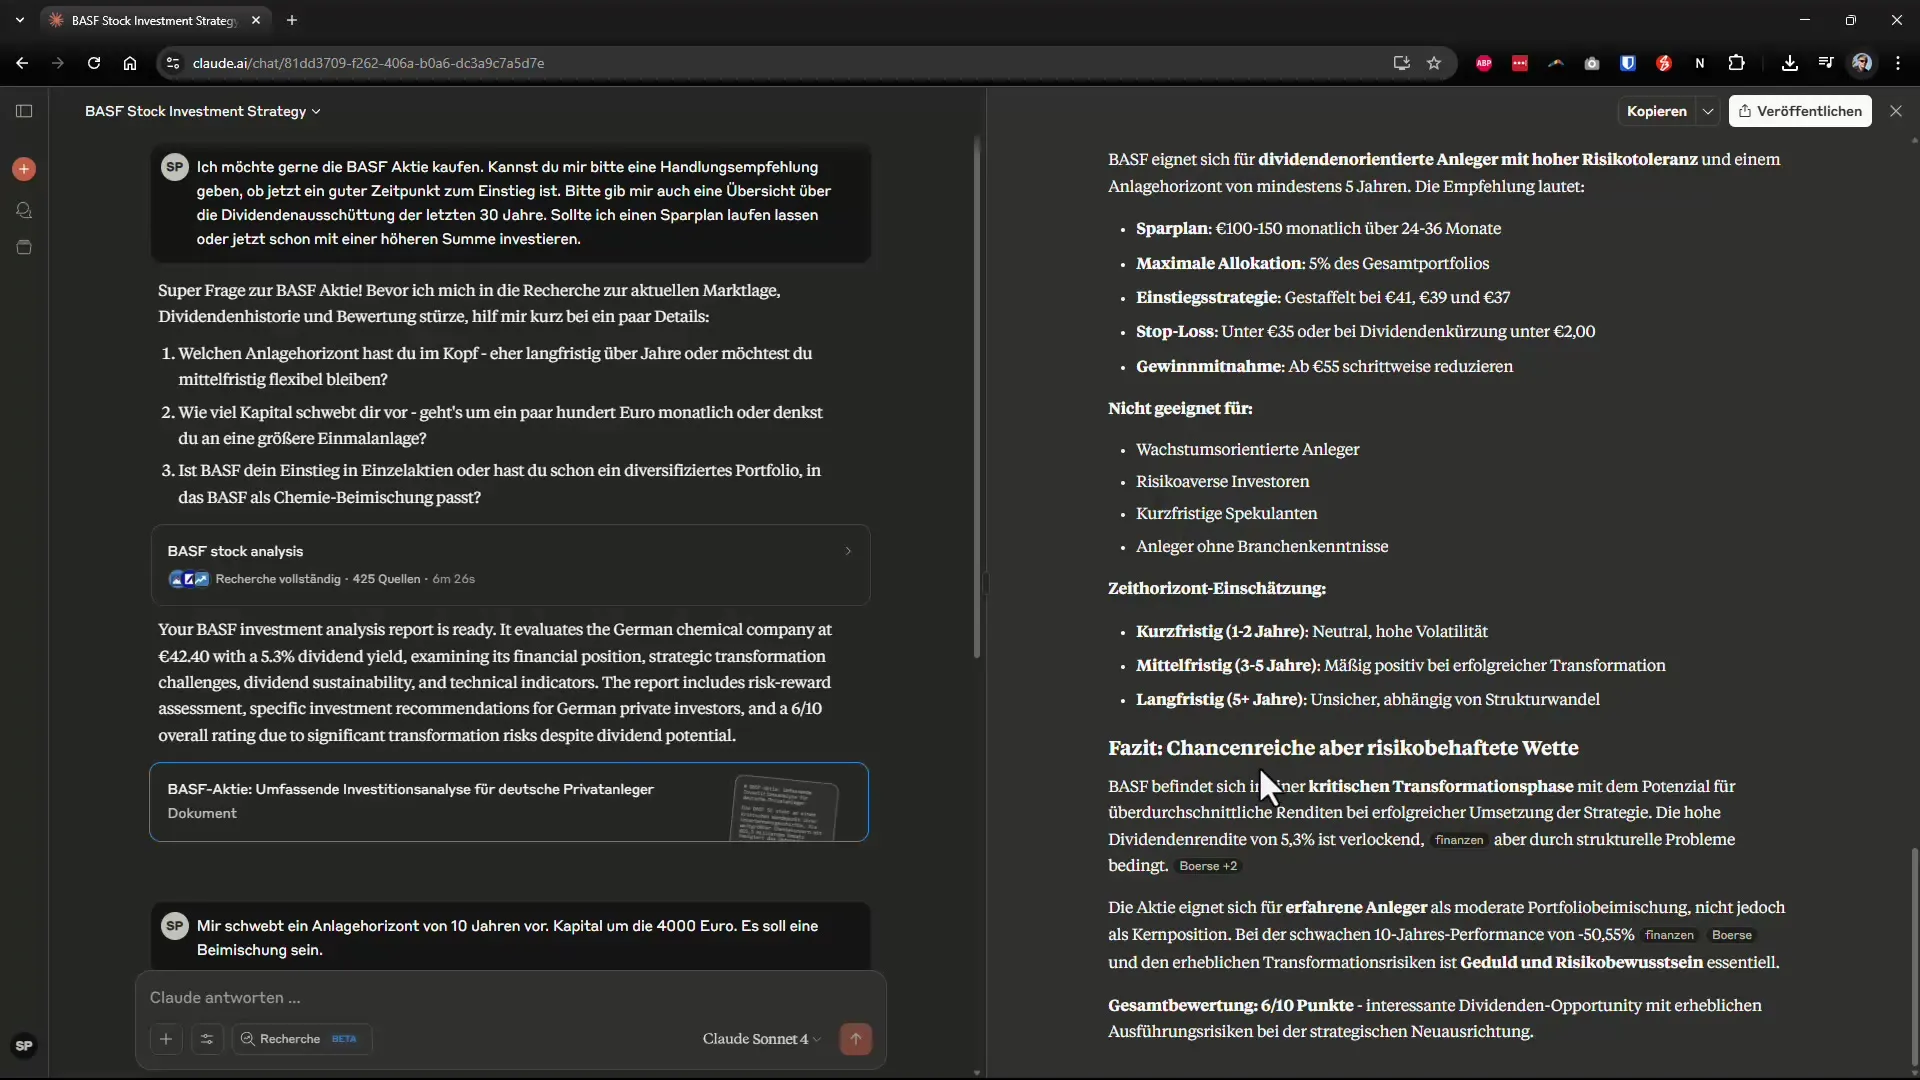
Click on the analysis to see the final assessment. Don’t forget to also consider the risks and dividend prospects. This information is crucial for your decision and should be weighed carefully. The screenshot at this point illustrates the analysis and the relevant information.
Step 5: Creating the Interactive Graphic
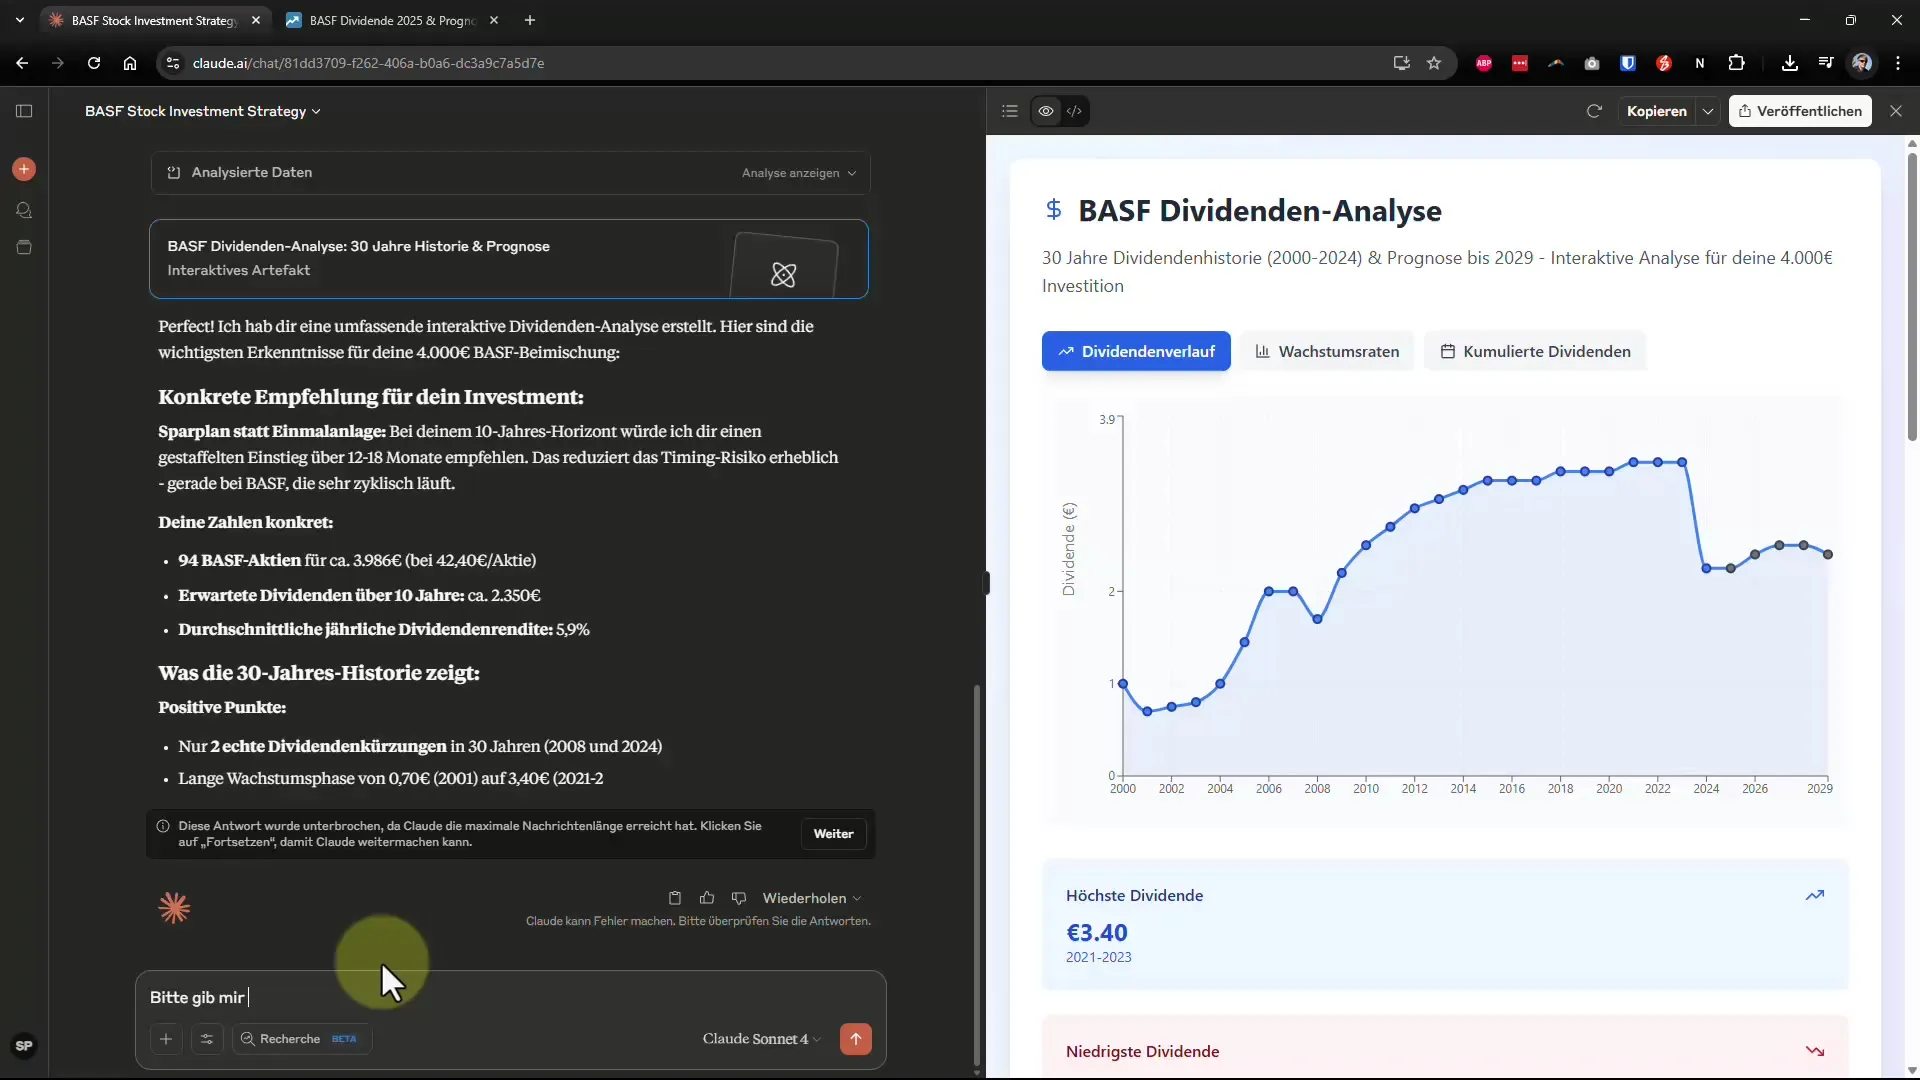
Take a screenshot of the dividend payouts to create a graphic. Copy this screenshot and ask Claude to create an interactive graphic of the dividend history. It is impressive how Claude generates the code without you needing deeper technical knowledge. The screenshot of this step shows the creation of the graphic.
Step 6: Adjusting the Graphic
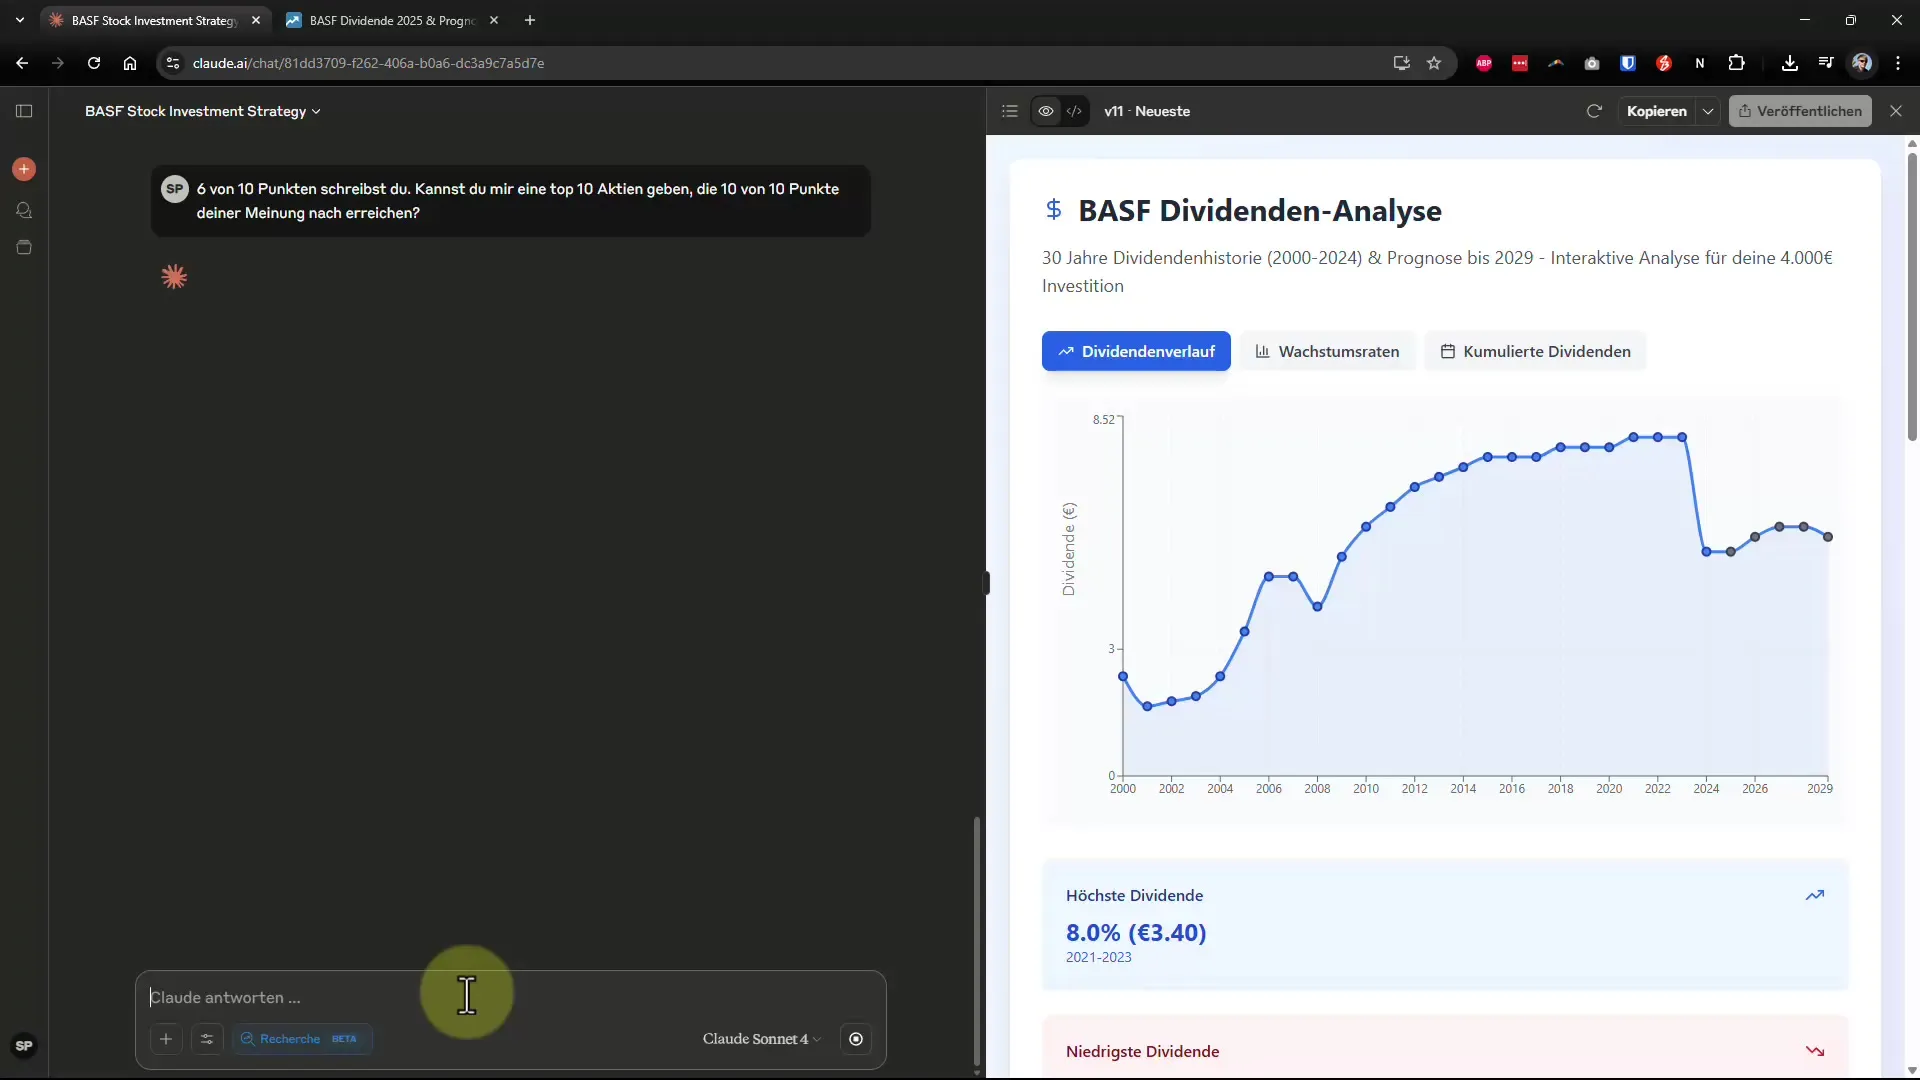
If you need the graphic in another form, such as the dividend in percentage instead of euros, you can simply ask Claude to adjust the code. Pay attention to how Claude makes the changes and creates the new graphic. A screenshot of the change process will help you to understandhow flexible the AI is.
Step 7: Conclusion and Further Recommendations
After reviewing the results and the interactive graphic, take a personal inventory. If you are still uncertain despite the analysis, you can make additional requests to Claude to find more options or similar stocks that meet your desired criteria. This is the final screenshot that shows the conclusion of your analysis.
Summary – Claude AI as Your Financial Analyst
With the steps described, you have learned how to efficiently use Claude's AI for analyzing BASF stock. From research to creating interactive graphics, you can obtain all the necessary information to make informed decisions and optimize your investment strategy.


