Do you want to take your presentations to the next level and provide more structure to the content? An excellent way to achieve this is through flowcharts. They not only help to present complex information, but also make your slides more visually appealing. In this guide, you will learn step by step how to create flowcharts in PowerPoint using the various drawing tools. Let's get started!
Key Insights
- Flowcharts help to present information clearly.
- You can use various shapes to visualize your ideas.
- Editing shapes and lines is easy and efficient in PowerPoint.
Step-by-Step Guide
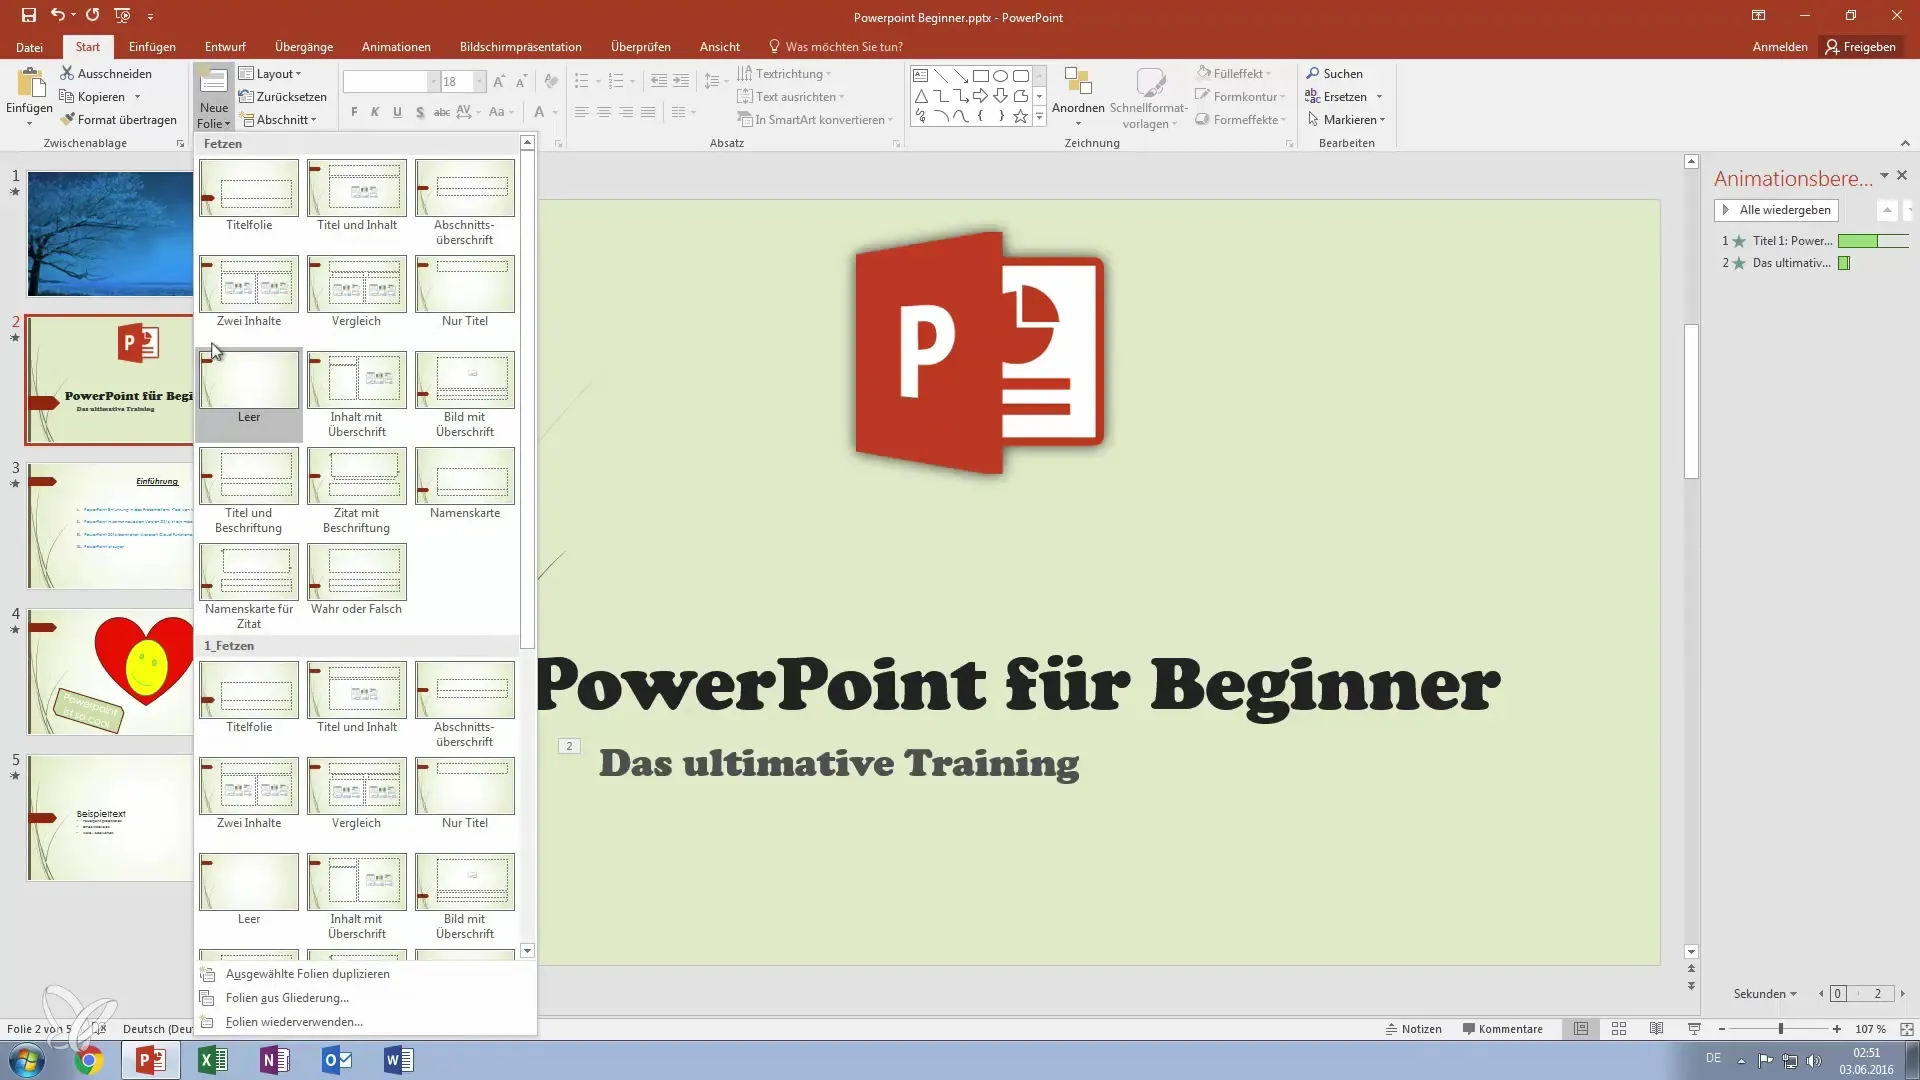
First, we open PowerPoint and add a new slide on which we will work. You can simply create a blank slide to maintain clarity.
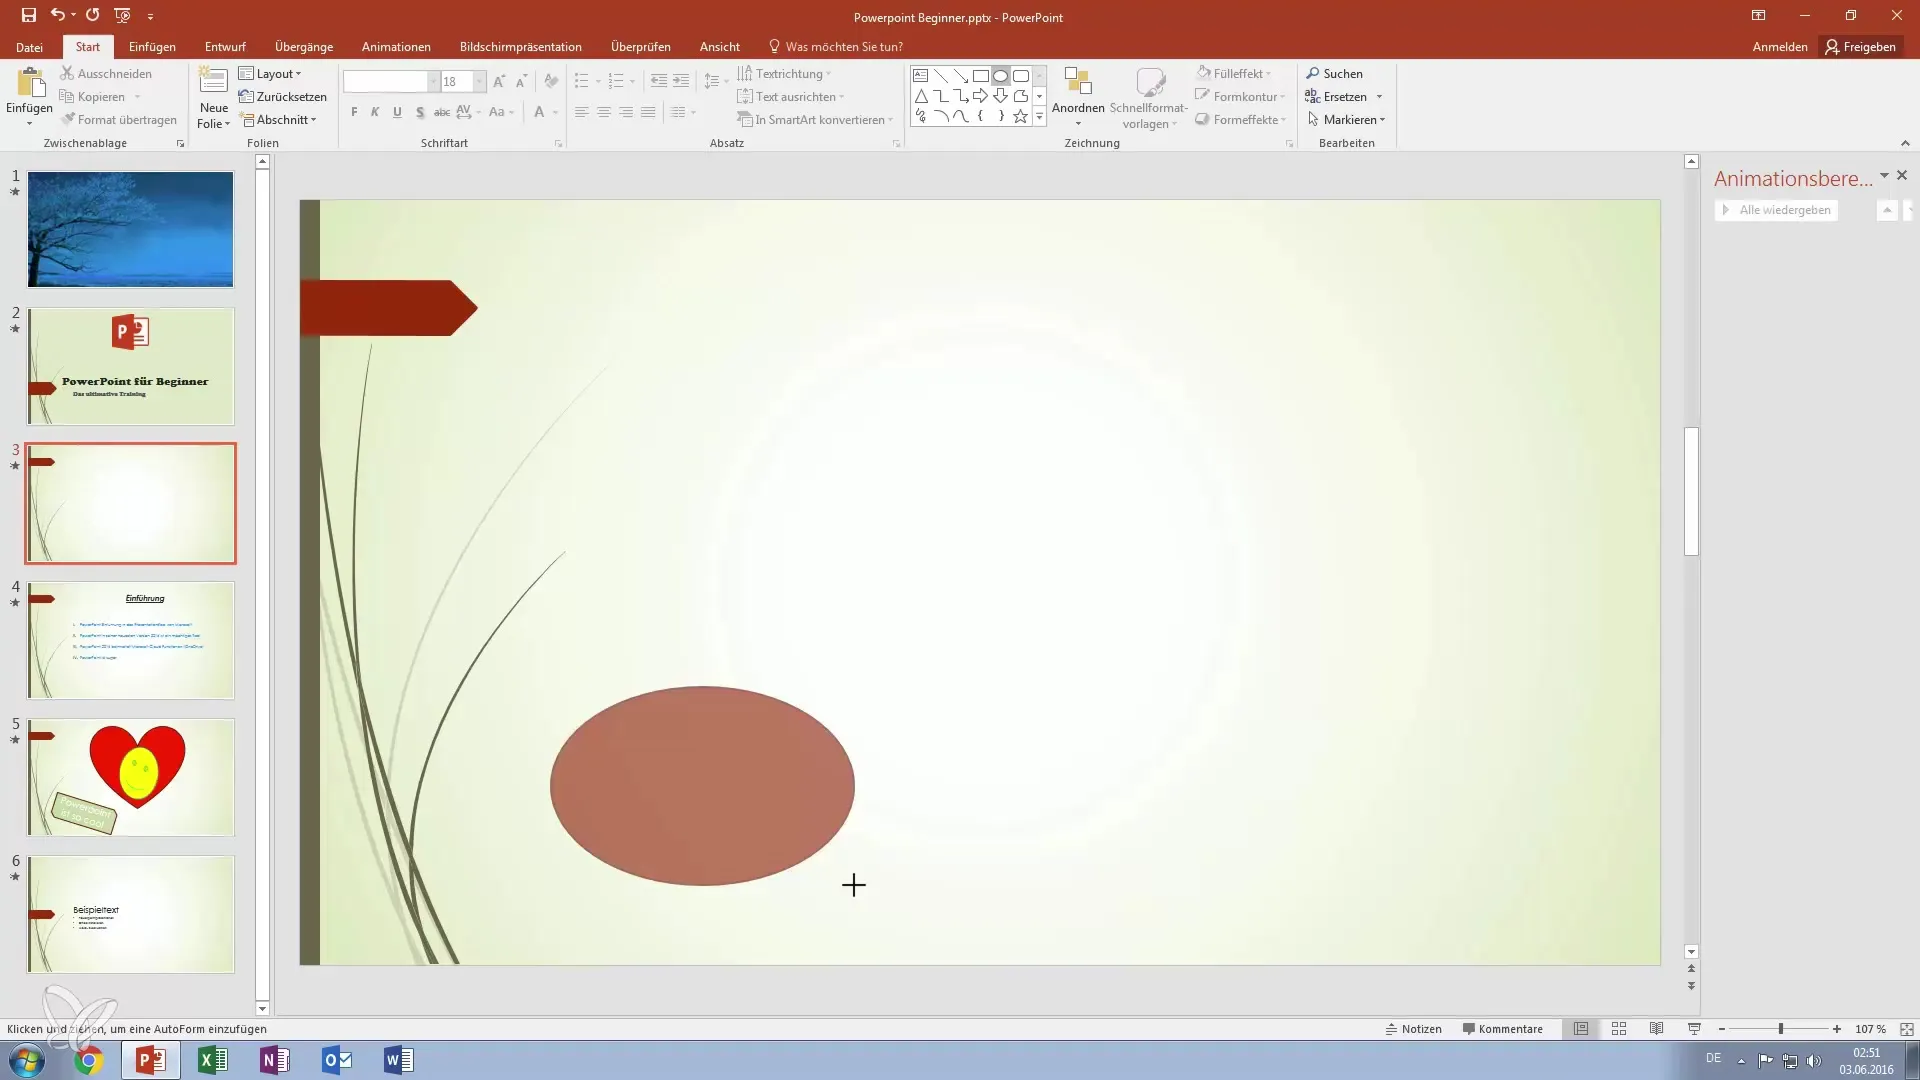
Next, go to the drawing tools in the "Home" menu and select an ellipse. This shape is great for representing points or steps in your flowchart. Draw the ellipse on the slide.
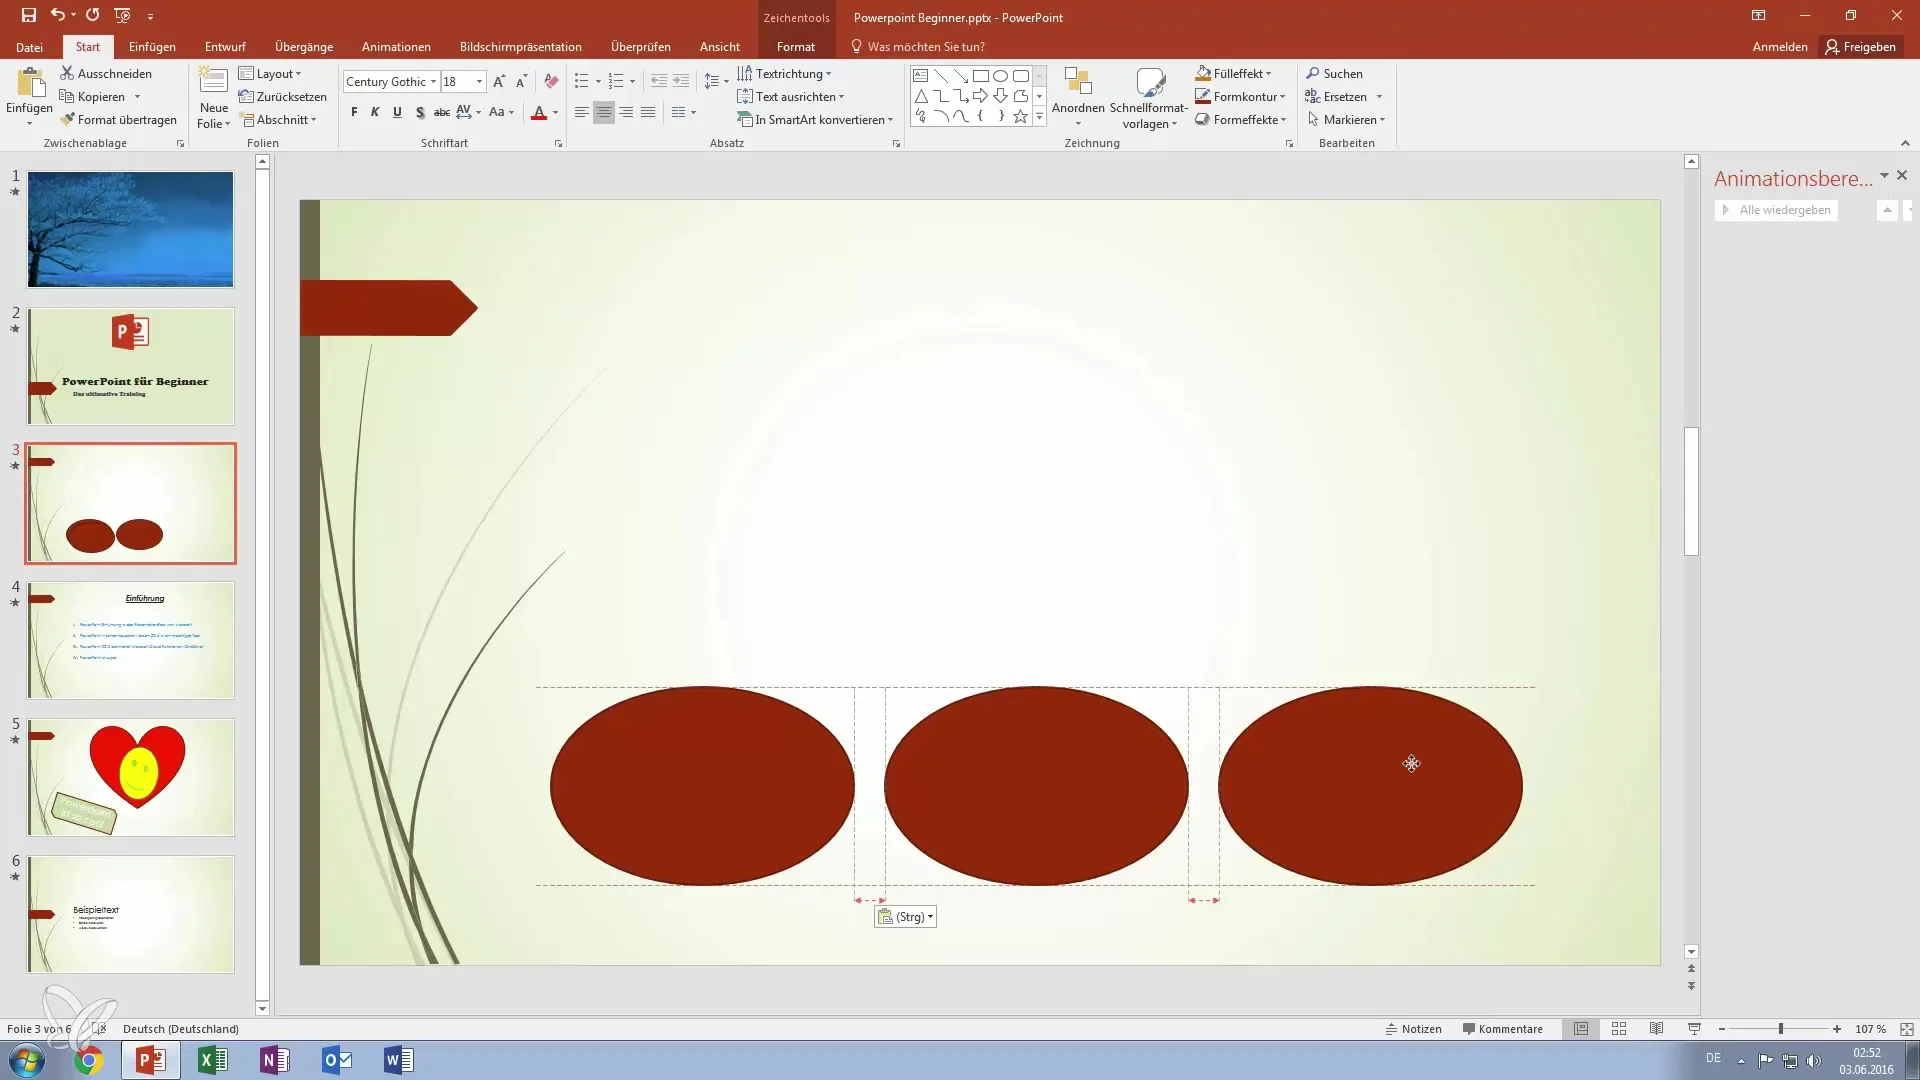
To create multiple ellipses, you can select the already drawn ellipse and create several copies using "Ctrl + C" (copy) and "Ctrl + V" (paste). Place them so that they are evenly distributed on the slide. PowerPoint automatically calculates the spacing between shapes, which saves you time.
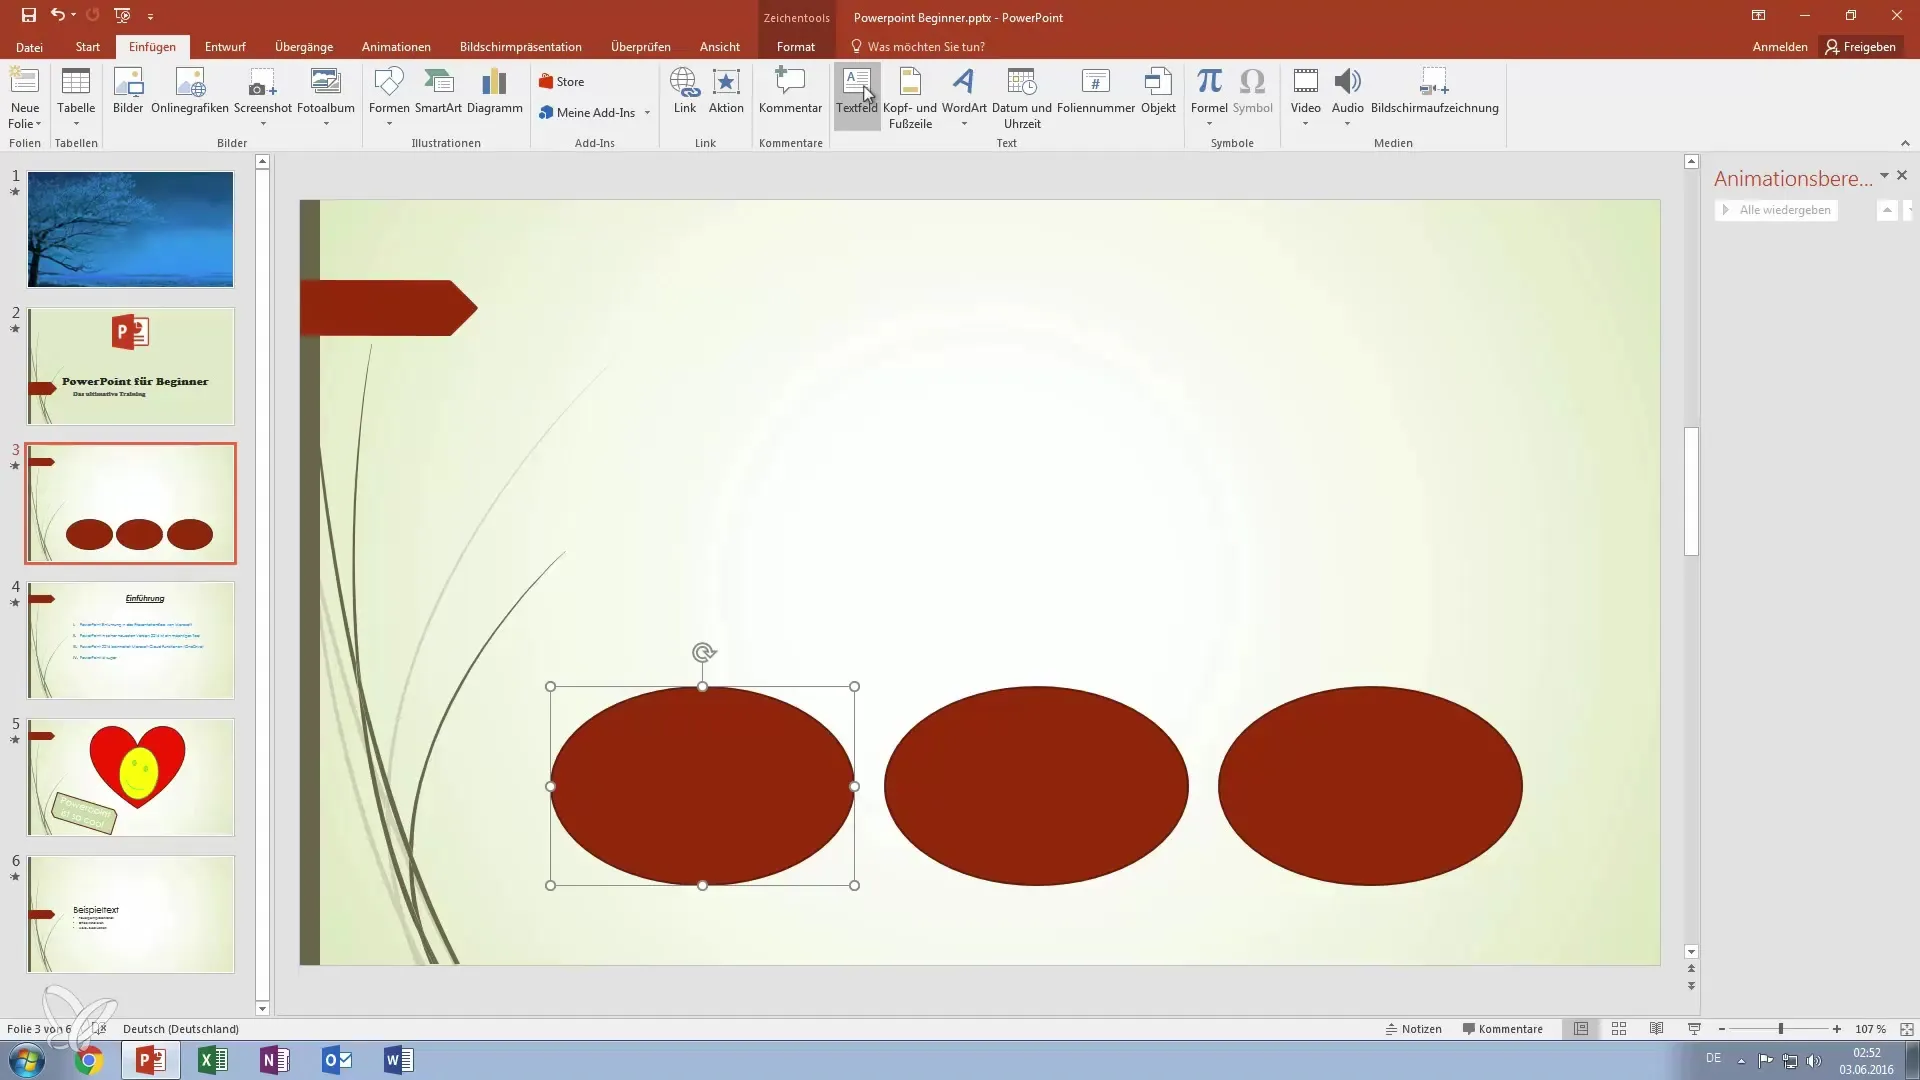
Now we add text to fill the ellipses with information. Click on the ellipse, go to the "Insert" menu, and select "Text Box". Here you can specify "PowerPoint 2010" or other versions you want to represent.
To create a multidimensional overview of different PowerPoint versions, insert additional text boxes, e.g., for "PowerPoint 2003" or "PowerPoint 2016". Make sure the font is slightly larger and bold so that important information stands out.
Now it's time to connect the ellipses. Draw a line by selecting the line in the "Home" menu and dragging it from one ellipse to another. This creates a connection between the different versions.
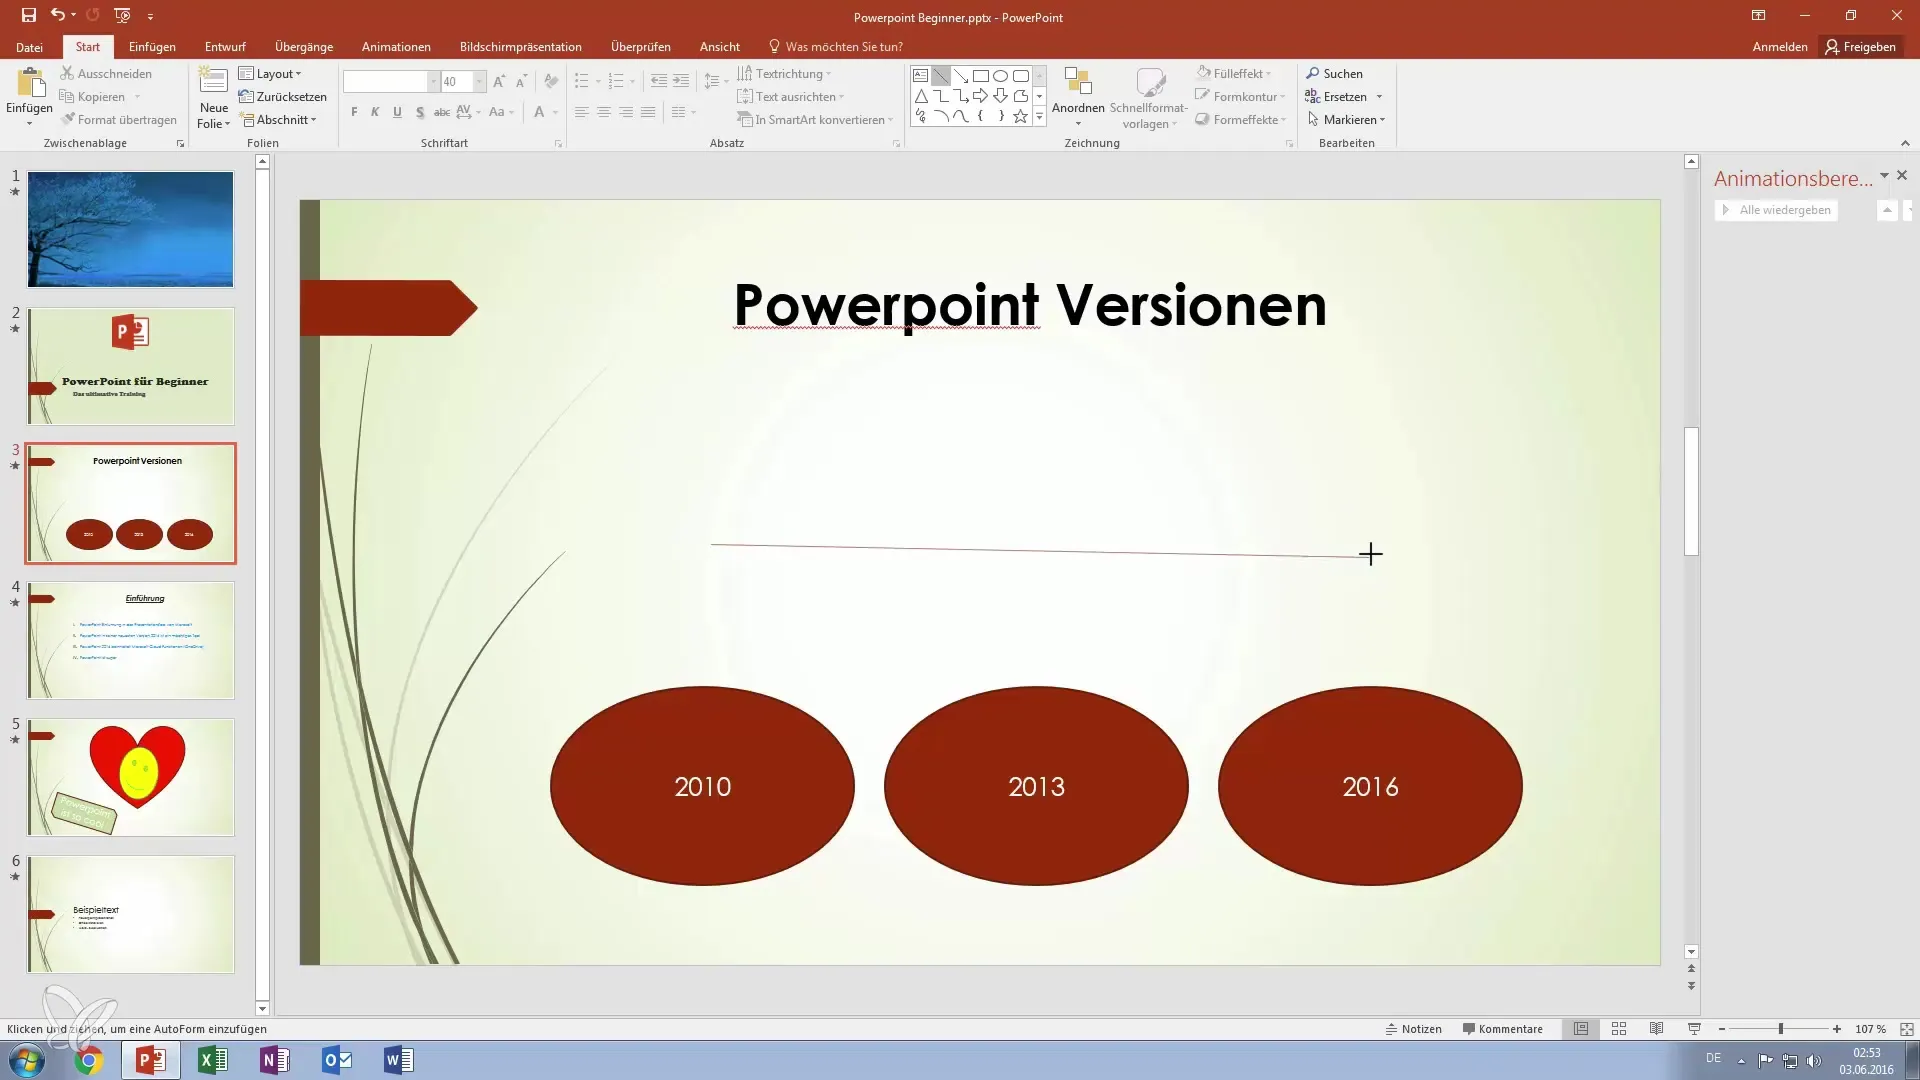
Once you have drawn the line, you can make various adjustments under the "Format Shapes" menu. Here you can adjust the line thickness to make it more visible. Choose a thickness that matches your design.
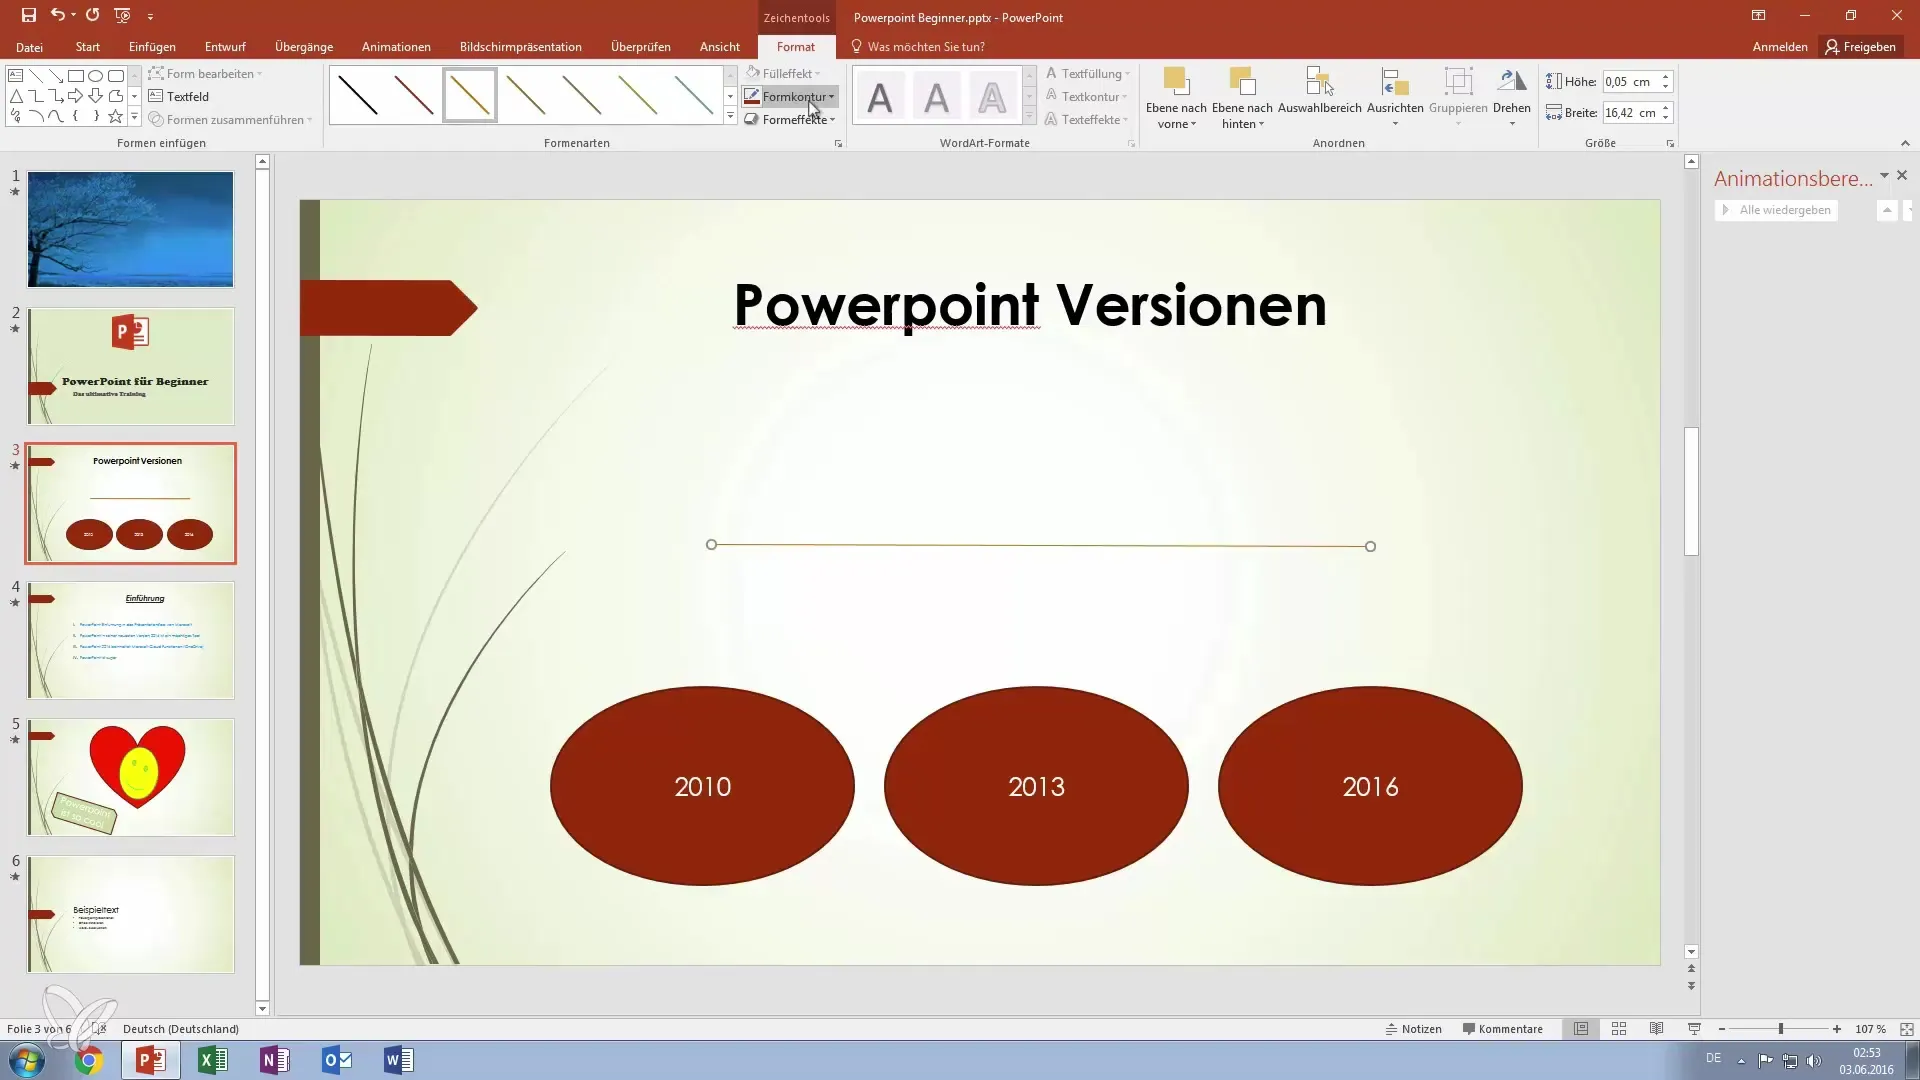
It often makes sense to use the same line multiple times to standardize the design. You can copy the line and paste it elsewhere to create additional connections between the ellipses.
Have you created your lines? Great! To ensure that all objects are in the correct order, select the lines you want to send to the back. Hold down the Shift key while selecting the lines, and then go to the "Shape Format" tools. Here you can arrange the lines to the back so that they appear underneath the ellipses.
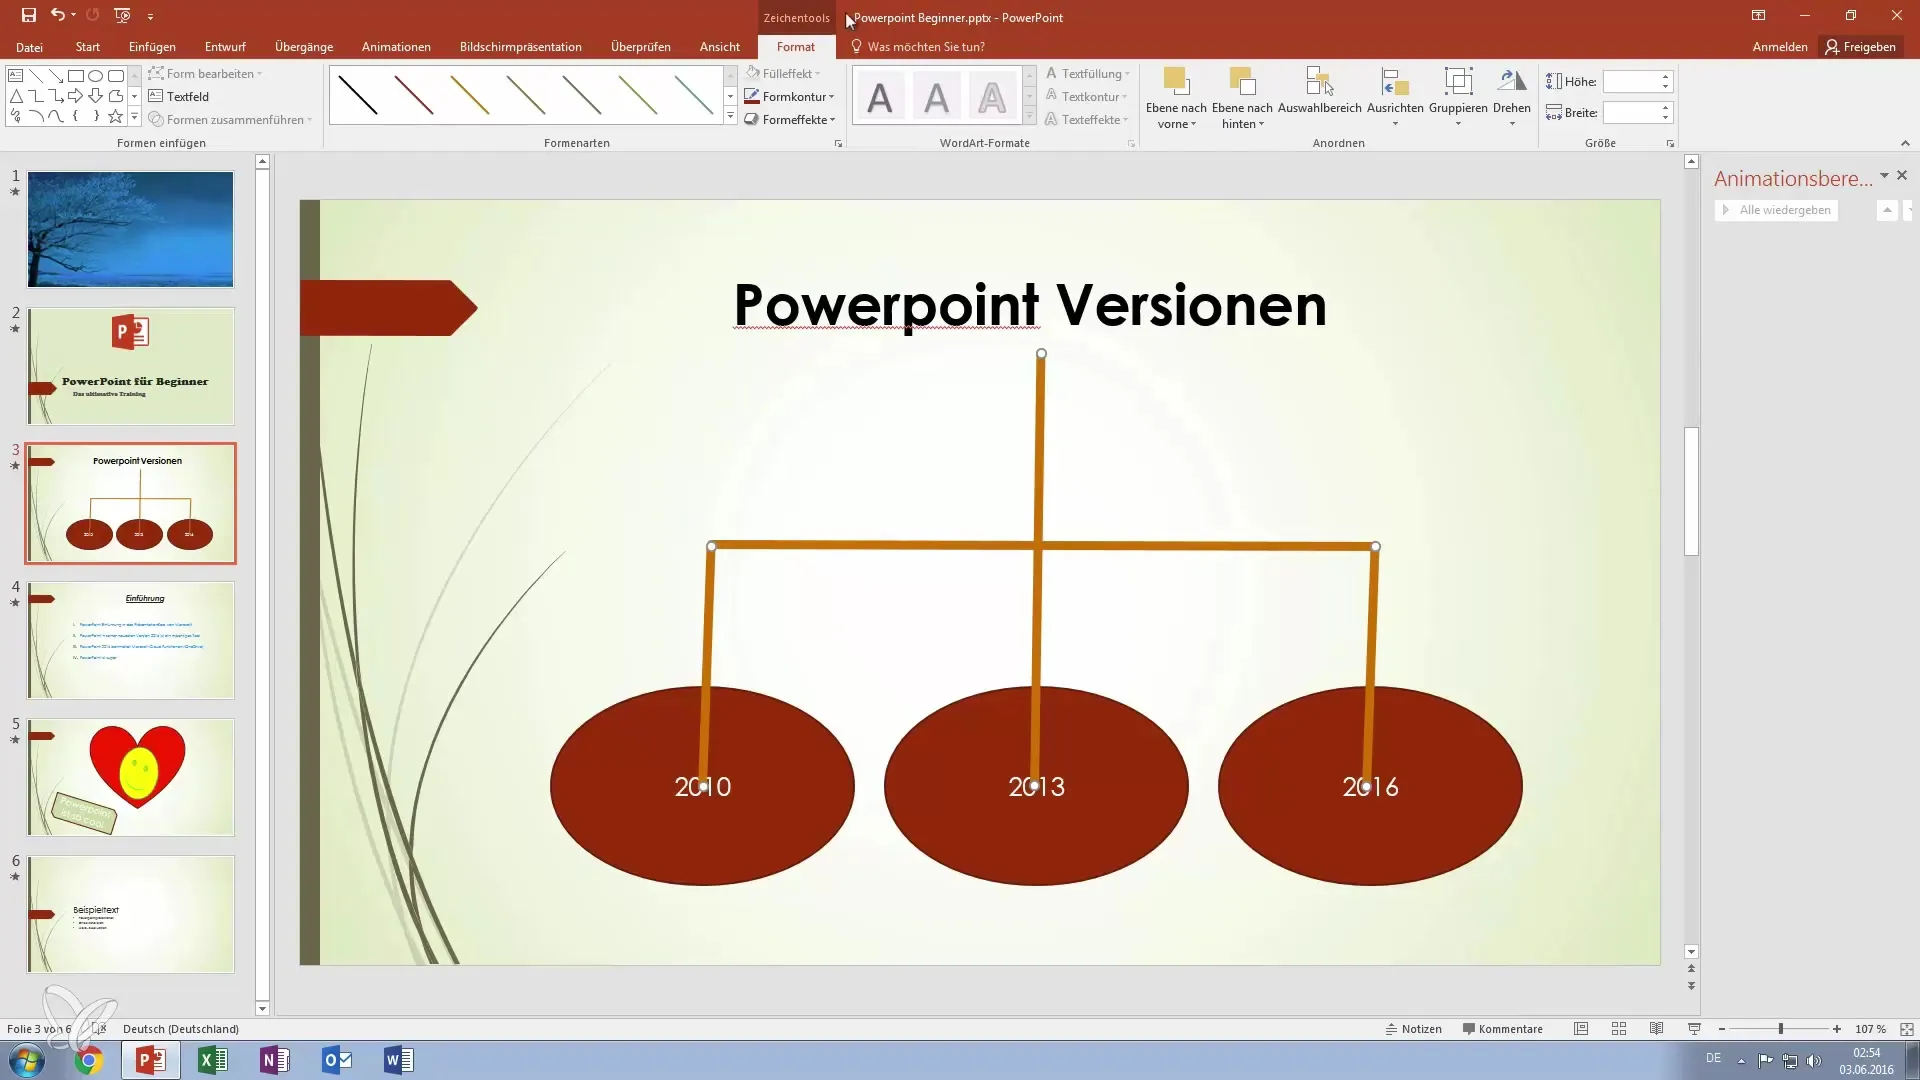
By clicking "Back" multiple times, you can ensure that all lines are placed behind the ellipses. Now you should see a clear representation of your PowerPoint versions in the form of a flowchart, which is visually appealing and informative.
You have now successfully created a simple flowchart in PowerPoint! This has given you an overview of the different versions, and you have established the basics of working with shapes. If you have any further questions, feel free to contact me!
Summary – PowerPoint Flowcharts: Create Clear Overviews with Drawings
Creating flowcharts in PowerPoint is an effective way to present information succinctly. You have learned how to use different shapes, add text, and connect them graphically to create informative slides.
Frequently Asked Questions
How do I add a new slide in PowerPoint?You can simply select the "New Slide" option and create a blank slide.
How do I copy shapes in PowerPoint?Select the shape and use the shortcut "Ctrl + C" to copy and "Ctrl + V" to paste.
How do I change the line thickness in PowerPoint?Select the line, go to the "Format Shape" tools, and adjust the thickness as desired.
How can I change the arrangement of objects?Select the objects, go to "Format Shape" tools, and choose the "Arrange" option to bring them to the back or front.
How do I add text to an ellipse?Click on the ellipse, go to "Insert," and select "Text Box" to insert your text.


