Imagine you're moving the exposure slider back and forth and in the end you don't know whether the image has gotten better or worse. You put an end to exactly this guesswork with the histogram. It is the most important chart in image editing, and once you can read it, you can recognize underexposure and overexposure at a glance. After that, you correct the exposure with reasoning instead of going by gut feeling.
The video is only loaded from YouTube when you play it – data (including your IP address) is then transmitted to YouTube/Google. More in the privacy policy
Key Takeaways
- The histogram shows the brightness distribution of your image. The dark tones and shadows are on the left, the bright tones and highlights on the right.
- The height of the curve indicates how many pixels have a certain brightness.
- If the curve piles up on the left, the image is underexposed. If it piles up on the right and hits the edge, it is overexposed.
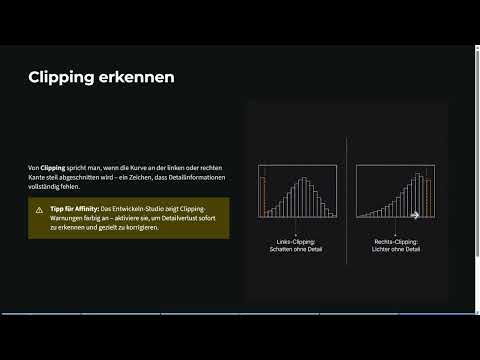
- A curve that is cut off steeply at the edge is called clipping. In this case, details in the shadows or highlights are lost.
- A balanced histogram uses the entire tonal range without hitting the edges. This gives you the greatest room for later adjustments.
- The histogram is more reliable than your eye, because a monitor can distort brightness and contrast significantly depending on its settings.
Step-by-Step Guide
Step 1: Reading the Brightness Distribution
Start by looking at the histogram as a map. The left side represents black and shadows, the right side white and highlights. The middle forms the midtones. The height of the curve at a given point tells you how many pixels have exactly that brightness. A good mnemonic: left is dark, right is bright, higher means more pixels. Once you have internalized this, you can classify any histogram immediately.

Step 2: Recognizing Underexposure
You can tell underexposure by the curve piling up on the left. The image then looks too dark because a large portion of the pixels lie in the shadow area. The biggest danger here is that shadows get crushed and details are lost in the dark. An image with visible details in the shadows should therefore not be distributed like this. You recognize the problem before you have even moved a slider.

Step 3: Aiming for the Ideal Histogram
Your goal is a distribution that is as even as possible across the entire range, without the curve forming peaks at the edges. This is called a full tonal range. Then you have no piling up, enough room for corrections, and all brightness levels in use. For a normal photo, this is usually the perfect state.

Step 4: Recognizing Overexposure and Clipping
If the curve piles up on the right and hits the edge, the image is overexposed. Blown-out highlights are particularly critical, because details are irretrievably lost there. A curve that is cut off steeply on one side is called clipping. It shows you that detail is missing in the shadows or highlights. In rare cases, clipping can be intentional, but in most cases it is a warning sign.

Step 5: Using the Clipping Warning in Affinity
Affinity also displays clipping directly. The histogram is located at the top right of the interface. If a warning appears there, something is wrong with the tonal values. Often it is a single outlier, for example at the right edge. So take a close look at the warning before you change the exposure, because it tells you where the problem lies.

Step 6: Balancing the Exposure
Now the slider comes into play. Move the exposure slider to the right and watch how the entire curve shifts to the right and the image becomes brighter. If you pull it all the way to the right, everything becomes overexposed. If you push it far to the left, the curve moves into the dark area. The trick lies in balancing. Reduce the exposure a little until the curve moves back to the middle. With the black point and brightness, you can then make finer corrections without throwing the midtones out of balance.

Step 7: Create the Foundation with White Balance
Before you fine-tune brightness and contrast, it's worth setting the white balance. Look for a spot in the image that should actually be neutral white or gray, and click on it with the eyedropper. The histogram often improves noticeably as a result, and you work on a more reliable foundation. Hold down the mouse button while probing to find a good spot. As you do, you can see how the histogram reacts. Take the time to choose a point that seems right to you.

Step 8: Trust the Histogram More Than the Monitor
Your screen can easily deceive you. An image looks good on the monitor even though the brightness is too high or too low because of the settings. If you turn the monitor brightness down, everything suddenly looks dark. Therefore, don't rely on your eye alone, but use the histogram as an advisor. It objectively shows you where the tonal values lie. Your eye remains important, but it only complements the numbers.

Step 9: Fine-Tuning and Handing Over to the Pixel Persona
Finally, you can check red, green, and blue individually. If a color channel lies clearly off, it can be corrected specifically, for example via saturation or luminosity. Once the image is satisfactory, you click on "Develop". After that, you return to the Pixel Persona and all pixel-based tools are available to you again. Developing is thus the transition from correcting the raw image to further editing.

Summary – Reading the Histogram in Affinity Correctly and Correcting Exposure Precisely
The histogram turns exposure corrections from guesswork into a traceable process. You read the shadows on the left and the highlights on the right, and you can immediately tell from the curve whether an image is underexposed or overexposed. Pay particular attention to clipping, because cut-off curves mean lost details. Use the clipping warning in Affinity, balance the exposure, and trust the histogram more than your monitor. With a white balance as the starting point and an even distribution without piling up, you create the best conditions for any further editing.
FAQ
What exactly does the histogram show?The histogram shows the brightness distribution of your image. The dark tones and shadows are on the left, the light tones and highlights on the right. The height of the curve indicates how many pixels have the respective brightness.
How can I recognize an underexposed image?The curve piles up on the left side. The image then looks too dark, and details in the shadows can be lost.
What does clipping mean?Clipping occurs when the curve is sharply cut off at the left or right side. Then details are missing in the shadows or highlights.
Is clipping always bad?As a rule, yes, because details are lost. In rare cases, however, it can be intentional, for example with a deliberately stylized look.
What does an ideal histogram look like?The distribution uses the entire tonal range evenly and does not hit the edges. This gives you maximum room for corrections.
Why should I trust the histogram more than my eye?Your monitor can distort brightness and contrast depending on its settings. The histogram objectively shows the actual tonal values.
What does white balance do for the histogram?A white balance with the eyedropper on a neutral spot often improves the color and tonal value distribution and creates a better foundation for further adjustments.
What happens after clicking "Develop"?You return to the Pixel Persona and can use all pixel-based tools again.


