
A finished report in MS Project often looks good, but it doesn't always match your requirements. Maybe you want to adapt colors and fonts to your company, insert images, or add your own tables and charts. This guide shows you exactly that. You will learn how to open the report draft, design it, and adjust it so that it fits on one page.
The video is only loaded from YouTube when you play it – data (including your IP address) is then transmitted to YouTube/Google. More in the privacy policy
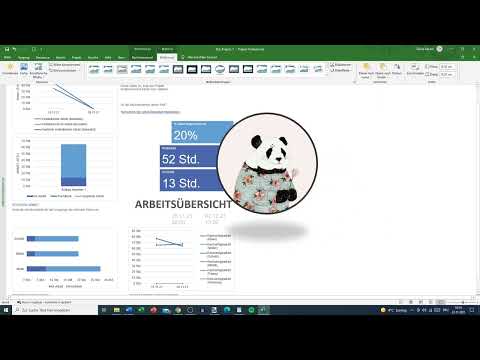
The guide is based on a practical example using the dashboard report "Work Overview". You don't need to understand the content of the report itself. All that matters is how you edit it.
Key Takeaways
Key Takeaways
- You can find the report draft via the Reports section and the Report Tools. There you can adjust the design, layout, and content.
- You can define colors, fonts, and effects individually or adopt them via ready-made color combinations.
- Images, shapes, text boxes, tables, and charts can be inserted and edited just like in Word or PowerPoint.
- For tables, you choose the fields yourself, for example outline number, start, finish, or cost.
- For extensive reports, you shrink individual elements so that the report fits on one page.
Step-by-Step Guide
Step 1: Open the Report
First, open the Reports section in MS Project. There you will find the cost reports you already know. For more detailed editing, choose the dashboard and then the report "Work Overview". This report is very extensive and contains remaining work, planned work, completed work, and residual work. You don't have to analyze every metric in detail, because this is about the design.

Step 2: Access the Report Draft
Now switch to the Report Tools in the menu bar. There you will find the Report Draft option. As soon as you click it, you can edit the report without changing the original data. Be prepared that the area doesn't behave the same everywhere, so it's worth taking a calm look at the buttons.

Step 3: Adjust the Design
In the Design area, you can change the design. For example, you can select a design like Segment. This design determines the color structure, including badges, base, and other elements. When you choose a design, these areas are immediately applied throughout the entire report. So try out different variants until you like the structure.
Step 4: Define Colors
You can either adopt the colors from a predefined color combination or choose them yourself. Microsoft offers ready-made combinations that match harmoniously. If you need your own colors, such as company colors, you can color each area individually. This way you keep an eye on readability and avoid color combinations that make the report look cluttered.

Step 5: Select the Font
Under Fonts, you define which font is used in the report. Common options are Calibri or Candara. For headings, a bolder font such as Arial Black is often suitable. Make sure the font remains easy to read, especially if you print the report later.

Step 6: Check Effects
You can also find the effects in the Design area. Options such as shadow or frosted glass are available there. These effects work mainly on objects and make the report look more modern. In most cases, however, you don't need them. Use them sparingly, otherwise the report quickly looks overloaded.
Step 7: Insert Images
To the right of the design, you can insert images. To do so, select an image file from your computer and insert it into the report. This works similarly to Word, PowerPoint, or Excel. Your image can then be resized and dragged to the desired position.

Step 8: Edit Images
When the image is selected, additional image tools are available to you. You can choose a frame, crop the image, or move it back one layer. The layer function is important if the image is supposed to sit behind a block or a table. This way you achieve a clean design without overlaps.

Step 9: Inserting Shapes, Fields, and Charts
Besides images, you can also insert shapes. These serve for visual structuring, for example as a background for headings. In addition, you can create new fields and use charts. Charts are a separate section, which you will get to know in more detail in step 13.

Step 10: Inserting and Configuring Tables
You already know tables from other reports. In the report draft, however, you can design them freely. You decide for yourself which columns appear. To do this, click on the table and select the fields you want to display. Possible fields are the number, the outline number, the name, the start, and the finish.

Step 11: Selecting Fields
When you define the fields, you also determine which information ends up in the report. You can also enter resource names here. In addition, you distinguish between tasks and resources. For your report, you select suitable fields, for example start and finish. Make sure not to select too many fields so that the table stays clear and easy to read.

Step 12: Adding Cost Information
In many cases, cost figures are more important than pure dates. Therefore, select fields such as total cost, cost variance, or cost per use, provided you have entered these values. This creates a report that is also suitable for budget meetings.

Step 13: Adding Text Boxes
You can also insert text boxes. To do this, click the corresponding icon and write your text directly into the box. Text boxes are suitable for explanations, notes, or a brief summary. You can move them freely so that they sit next to tables or charts.

Step 14: Selecting a Chart
You insert charts via the chart function. You can choose between different types, for example column, line, pie, or bar charts. When you hover the mouse over a type, you see a larger preview. For your report, you choose the type that presents your data most clearly. A column chart, for example, is well suited for comparing tasks.

Step 15: Inserting and Moving the Chart
After the selection, the chart appears in the report. Make sure to move the entire frame of the chart and not just the inner area. Only this way do you move the complete object. Afterwards, you can move it to the desired position and adjust its size.

Step 16: Defining Chart Data
In the chart, you decide whether tasks or resources are displayed. For a task chart, you select only tasks. In addition, you can distinguish between completed and remaining tasks. Once you have set these options, your report is finished in terms of content.

Step 17: Saving and Printing the Report
When you are satisfied with the result, you save the report. If needed, you can also print it directly. Before you do so, you should check the page preview, because an extensive report is quickly spread across several pages.

Step 18: Fitting the Report onto One Page
With a lot of content, the report can be split across up to four pages. You must therefore either use large paper or shrink the report. To do this, select the fields you want to shrink and significantly reduce their font size. Also shrink objects such as charts and tables. Then move them closer together so that all elements fit on one page.


Summary ??? Editing the MS Project Report Draft: Design and Charts
You have seen how to open and design the report draft in MS Project. You can adjust the design, colors, fonts, and effects, insert images and shapes, and configure tables and charts in a targeted way. Pay particular attention to keeping the report clear and making sure it fits on one page. With these steps, you create reports that work well both digitally and on paper.
FAQ
How do I find the report draft in MS Project?You can find it via the report tools in the menu bar by clicking on Report Draft.
Can I choose colors and fonts myself?Yes, you can freely choose colors and fonts or adopt a predefined combination.
Which images can I insert into the report?You can insert image files from your computer and then crop them, frame them, and move them within the layer.
How do I select the columns of a table?You decide on the fields of the table, for example outline number, start, finish, or cost.
How do I move a chart correctly?Move the entire frame of the chart and not just the inner area, otherwise you will only move a part of it.
What do I do if the report is printed on several pages?Reduce font sizes, tables, and charts, and arrange them so that everything fits on one page.


