
A project plan stands or falls with its tasks. Only when you capture the individual work steps cleanly, set durations and put them in the right order do you get a schedule you can actually work with. This guide accompanies you through exactly that. You will learn how to save your project, set up the right view, assign durations to tasks, link dependencies, create a summary task and set a milestone.
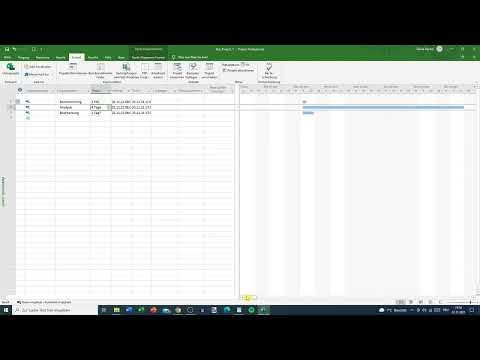
The video is only loaded from YouTube when you play it – data (including your IP address) is then transmitted to YouTube/Google. More in the privacy policy
A typical beginner's mistake is letting all tasks start at the same time. This happens faster than you think and often only becomes noticeable in the bar chart. The following steps show you how to avoid such problems from the start.
Key Takeaways
- Save your project early and regularly so that your entries are not lost if the program crashes.
- Use the bar chart (Gantt chart) to capture tasks and see their timeline directly.
- Switch new tasks to "Auto Scheduled" so that you don't have to set dates manually every time.
- Enter durations in the correct format, such as "2 h" for two hours or "3 t" for three days, and adjust them to your basic settings.
- Link consecutive tasks so that they do not start at the same time.
- Use summary tasks for structuring and milestones (duration zero) for important points in time.
Step-by-Step Guide
Step 1: Save the Project
Before you start entering data, secure your file. To do so, click the File icon at the top left and select "Save As". In the next window, you can either double-click directly on "This PC" or navigate to the desired folder via the tabs. Alternatively, use the "Browse" button. Choose a storage location and assign a unique file name, for example "Testprojekt".
After that, make sure you don't choose "Save As" again the next time you save. Clicking the Save icon simply overwrites the existing file and does not create an additional copy.


Step 2: Set the Right View
So that you can immediately recognize the flow of your project later, you need the bar chart. You display the view bar, which gives you an overview of the views, by right-clicking on the "Gantt Chart" label and then selecting "View Bar". This makes an overview appear at the bottom edge, through which you can switch between views.
In the bar chart, you work with the bars on the right side, while the table with the task names is on the left. Via the small arrow at the bottom edge or the "Resource Sheet" tab, you can also capture resources later. To get started, however, you stay in the Gantt chart.

Step 3: Enter Tasks
Now it's time for the actual tasks. Enter them in the topmost free row under "Task Name", for example "Brainstorming", "Analyse" and "Bearbeitung". Confirm each entry with the Enter key, and the next row will appear automatically. You deliberately leave the top row empty, as it is reserved for the summary task later.

Step 4: Understand the Task Mode
As soon as you create a task, a small icon with a question mark appears next to it. Clicking on it opens a window in which you can select the mode. There you can choose between the options "Manually Scheduled" and "Auto Scheduled". With manual scheduling, you set the start and end dates yourself. With automatic scheduling, MS Project calculates the dates from the duration and the dependencies.
Especially with larger projects, automatic scheduling is very helpful because the dates adjust themselves when a duration is changed. Therefore, leave the "Auto Scheduled" option selected for your tasks.
Step 5: Schedule New Tasks Automatically by Default
If you don't want to switch each task individually, a setting at the bottom left of the program helps. There you will find the "New Tasks" area, in which you can switch to "Auto Scheduled". From that moment on, all new tasks are scheduled automatically. This saves a lot of time and prevents you from having to repeat the same step for every entry.
Step 6: Enter durations
Now you enter the duration. To do this, you write the number in the "Duration" column and add the unit. With "h" you specify hours, with "t" days. A brainstorming session that lasts about two hours is therefore entered as "2 h". An entry like "1 h" results in one hour. Make sure the unit matches your basic settings, otherwise the program will calculate incorrect values. In the example, the analysis takes two days, and the processing also takes two days.
As soon as you change a duration, the bars in the bar chart shift. Tasks that take longer appear as wider bars. If you can see too little, hold down the Ctrl key and turn the mouse wheel to zoom in or out of the chart.

Step 7: Set the start date
You set the project start via the start date. If you enter a different date, the starting point of all automatically scheduled tasks adjusts accordingly. In the example, the start date was moved from the 22nd to the 25th. As a result, the start of the brainstorming also shifts to this date. You can choose whether you want to keep the previous dates.

Step 8: Link dependencies between tasks
After entering them, you usually notice that all tasks begin at the same time. That makes no sense, because the analysis requires the brainstorming and the processing requires the analysis. Therefore, select the three tasks by clicking on the first one, holding down the mouse button, and dragging down to the last task. Then click in the ribbon on the small chain icon named "Link the selected tasks". Alternatively, the keyboard shortcut Ctrl + F2 works.
Afterwards, the tasks are arranged one after another. The brainstorming starts first, the analysis starts three hours later, and the processing begins two days after the analysis. In the bar chart you now see the correct sequence.

Step 9: Create a summary task
To keep your plan clear, you combine related tasks into a summary task. To do this, enter a name in the topmost free row, in the example "Order Number 1". Then select the three subtasks and click on the arrow "Indent task". The three tasks move one level to the right, and the parent task becomes the summary task. In the chart it appears as a black bar that summarizes the subtasks.
The summary task also shows you the total duration. In the example, the result is a value of 4.38 days. The decimal places come from the hours of the brainstorming, because three hours correspond to about 0.38 days with an eight-hour working day.

Step 10: Set a milestone
A milestone marks an important point in time, such as the project end, without any work being involved. To do this, type in a name like "Project End" and enter the number zero as the duration, without a unit. You deliberately leave out the unit, since otherwise no milestone is created. In the chart, a dot appears instead of a bar. Then you link the milestone to the task after which it should take place, that is, to the processing. The project end then lies at the end of the processing.
Step 11: Place the milestone within the summary task
Make sure that the milestone is located under the summary task "Order Number 1". If it lies outside, it looks like a separate topic. To fix this, click on the milestone and use the arrow "Outdent task" so that it moves back to the level of the summary task. Afterwards, you link the tasks again and indent them. In the end, the milestone appears in the list as part of "Order Number 1".
Step 12: Finally save the project
Finally, you save your file via the save icon at the top left. This secures all tasks, durations, links, the summary task, and the milestone.
Summary ??? MS Project: Entering tasks step by step
You have learned how to record tasks in the bar chart in MS Project. You save your project safely, switch tasks to automatic scheduling, and enter durations in the correct units. In addition, you link tasks in the correct order, combine them into a summary task, and set a milestone that is correctly placed in the hierarchy. With this basic framework, you can build any further project in a structured way.
FAQ
How do I save my project in MS Project?Click on the save icon at the top left. The first time, you choose "Save As" and a storage location. After that, the save icon overwrites the file directly.
How do I show the view bar?Right-click on the "Gantt Chart" label and select "View Bar". The overview of the views then appears at the bottom edge.
What does "Auto Schedule" mean?With automatic scheduling, MS Project calculates start and end times from the duration and the dependencies. If you change a duration, the dates adjust automatically.
How do I enter a duration in hours or days?Write the number followed by "h" for hours or "t" for days, for example "2 h" or "3 t". Make sure the unit matches your basic settings.
How do I link tasks with each other?Select the relevant tasks and click on the chain icon "Link the selected tasks". Alternatively, you can use the keyboard shortcut Ctrl + F2.
What is a summary task?A summary task combines several subtasks. You create it by selecting the subtasks and choosing "Indent task".
How do I create a milestone?Give the task a name and enter the number zero without a unit as the duration. A dot then appears in the chart instead of a bar.
Why should I place a milestone within the summary task?Only then does it belong to the order in terms of content. If it lies outside, it appears as a separate topic in the list, and the overview becomes unclear.


