You want to find out how many visitors stay on your website and what the bounce rate is? Google Analytics is a powerful tool that helps you analyze important metrics and make decisions based on them. Let's take a look at the crucial numbers and what they can mean for your website.
Main Findings
The bounce rate indicates how many visitors leave the website without visiting another page. A high bounce rate may suggest that something is wrong with your website, while a low bounce rate in combination with a long session duration is a positive sign.
Step-by-Step Guide
1. Set up Google Analytics
Before you start your analysis, you should ensure that Google Analytics is correctly set up on your website. Go to Google Analytics and log in. If you haven't set it up yet, follow the instructions for registration and integration into your website.

2. View the Numbers
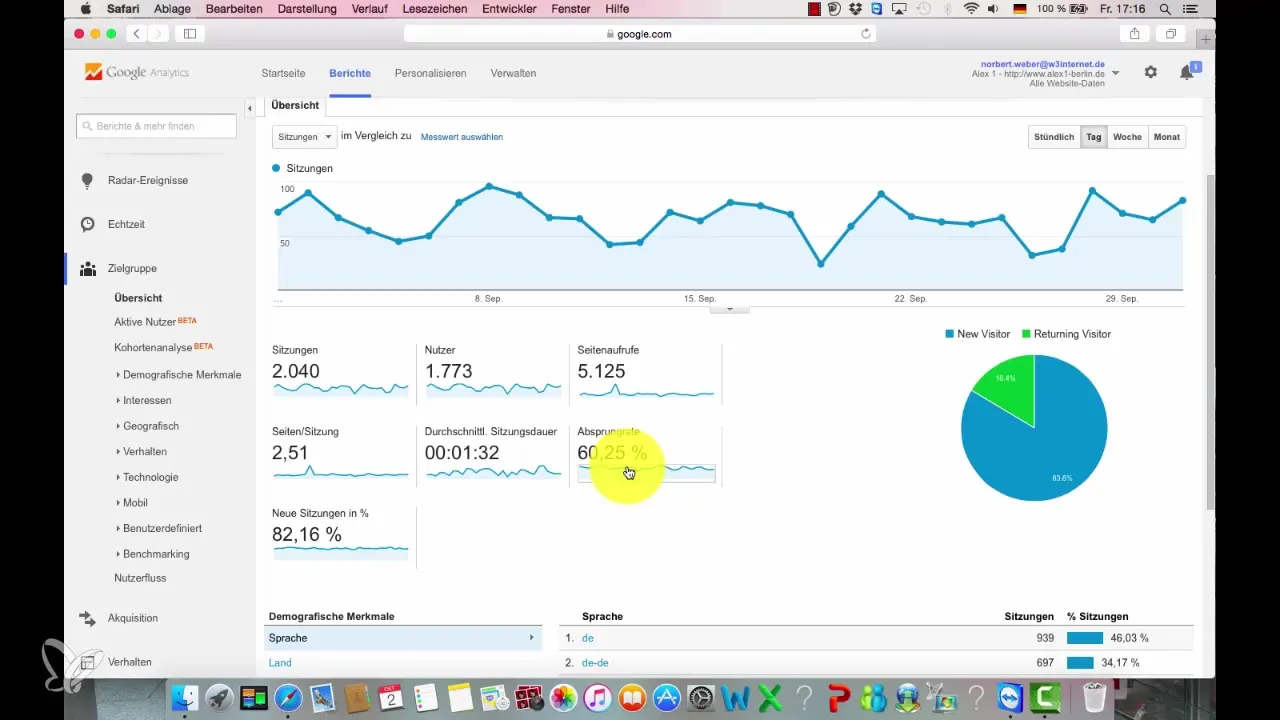
Once you're logged in, you can view the data for your website. Select the relevant report to see the key metrics. Pay special attention to the user numbers and the bounce rate. In the example, I see that the website had 1773 users this month.
3. Analyze the Bounce Rate
The bounce rate is a crucial factor. It stands at 60.25%, which is noteworthy. Generally, a bounce rate below 50% is excellent, while anything above 70% is concerning. It's important to understand the reasons for a high bounce rate.

4. Check the Average Session Duration
In the case of the website, the average session duration is 1 minute and 32 seconds. This long time may indicate that users are genuinely consuming the content. However, if this number is low and the bounce rate is high, alarm bells should ring.
5. Returning Visitors and Their Importance
Also, take note of the percentage of return visitors, referred to as “returning visitors.” In this example, this value is at 16.4%. This is a good indicator that visitors are having extended contact with the website and may be likely to come back.
6. Compare with Other Websites
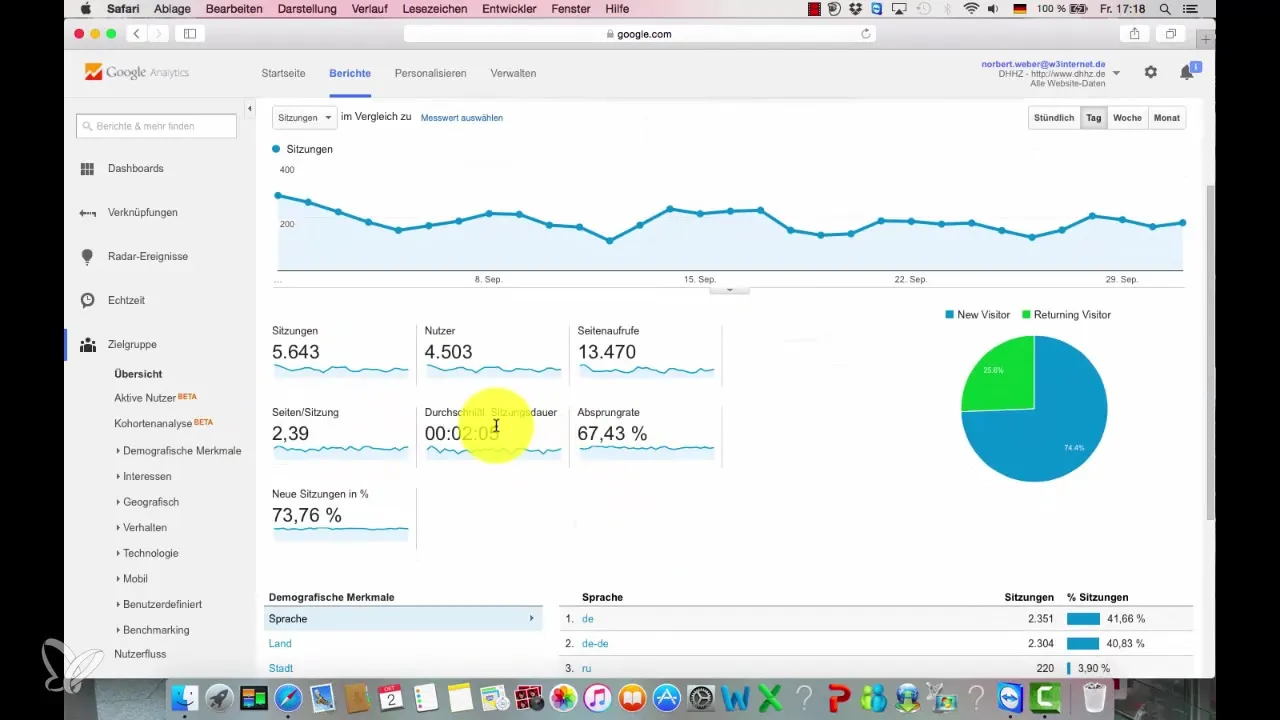
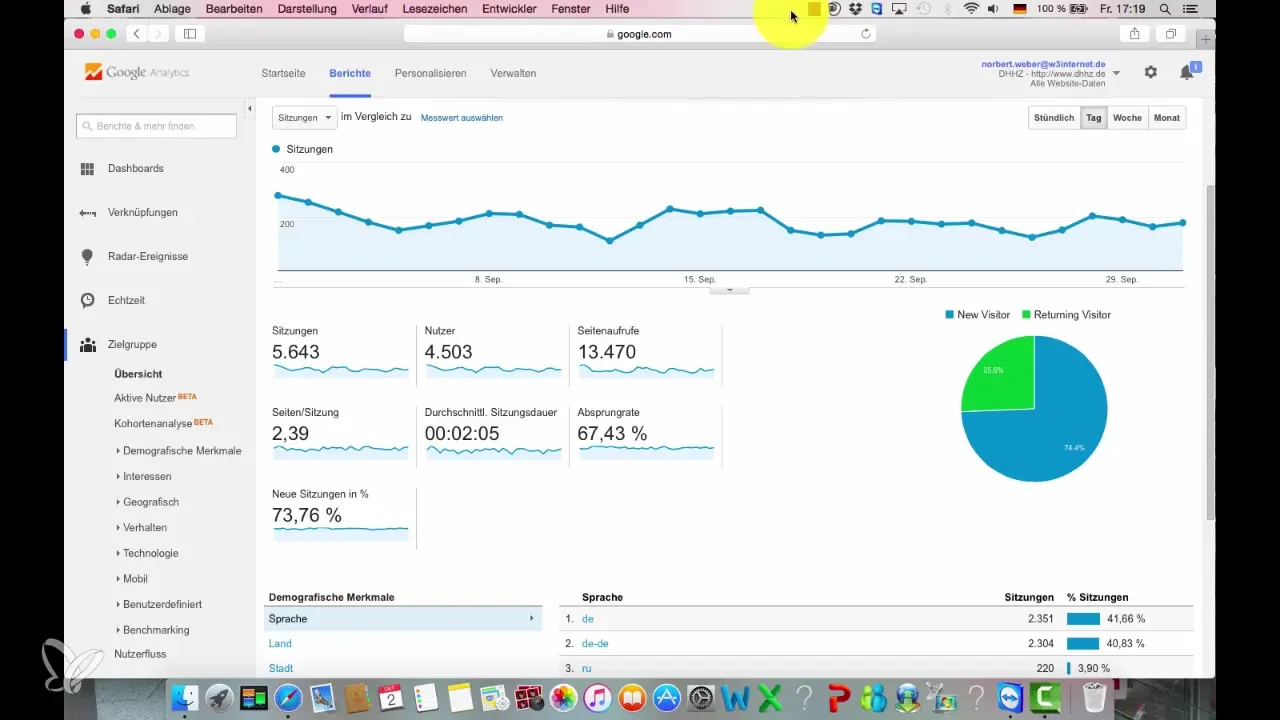
To gain a better understanding, you should also analyze similar websites. In comparison to other websites, you should gain differentiated insights into your own metrics to identify areas for improvement.

7. Monitor Trends
It's crucial to conduct regular analyses. Regularly check your numbers to identify trends. This could be weekly or monthly. Through ongoing monitoring, you can quickly respond if something changes.

Summary – Understanding Key Metrics in Google Analytics
To analyze your website's performance effectively, it's important to understand the bounce rate and the average session duration. These metrics help you recognize how well your content is received and where there is potential for improvement.
Frequently Asked Questions
What is a good bounce rate?A bounce rate below 50% is considered excellent.
How important is the average session duration?A long average session duration indicates that visitors are consuming content and are interested.
How often should I check my Google Analytics data?It is recommended to check the data at least once a week.
What does a high bounce rate mean?A high bounce rate can indicate that the content is unappealing or that the website does not provide the information being sought.
What role do "returning visitors" play?A high percentage of return visitors indicates that users are satisfied with your website and want to return.


