Photography offers countless opportunities to capture moments. However, it is often the lighting that makes the difference between an average and a breathtaking image. This is where the histogramcomes into play – an indispensable tool that can help you optimize the exposure of your shots. It shows you the distribution of brightness in your image and provides valuable information for post-processing. Let’s explore together how you can use the histogram effectively and avoid common mistakes.
Main insights
- The histogram shows the brightness distribution of an image.
- It helps to identify whether an image is underexposed or overexposed.
- Beginners should be cautious and initially rely on the camera display, while advanced users can use the histogram as an additional tool.
Understanding the Histogram
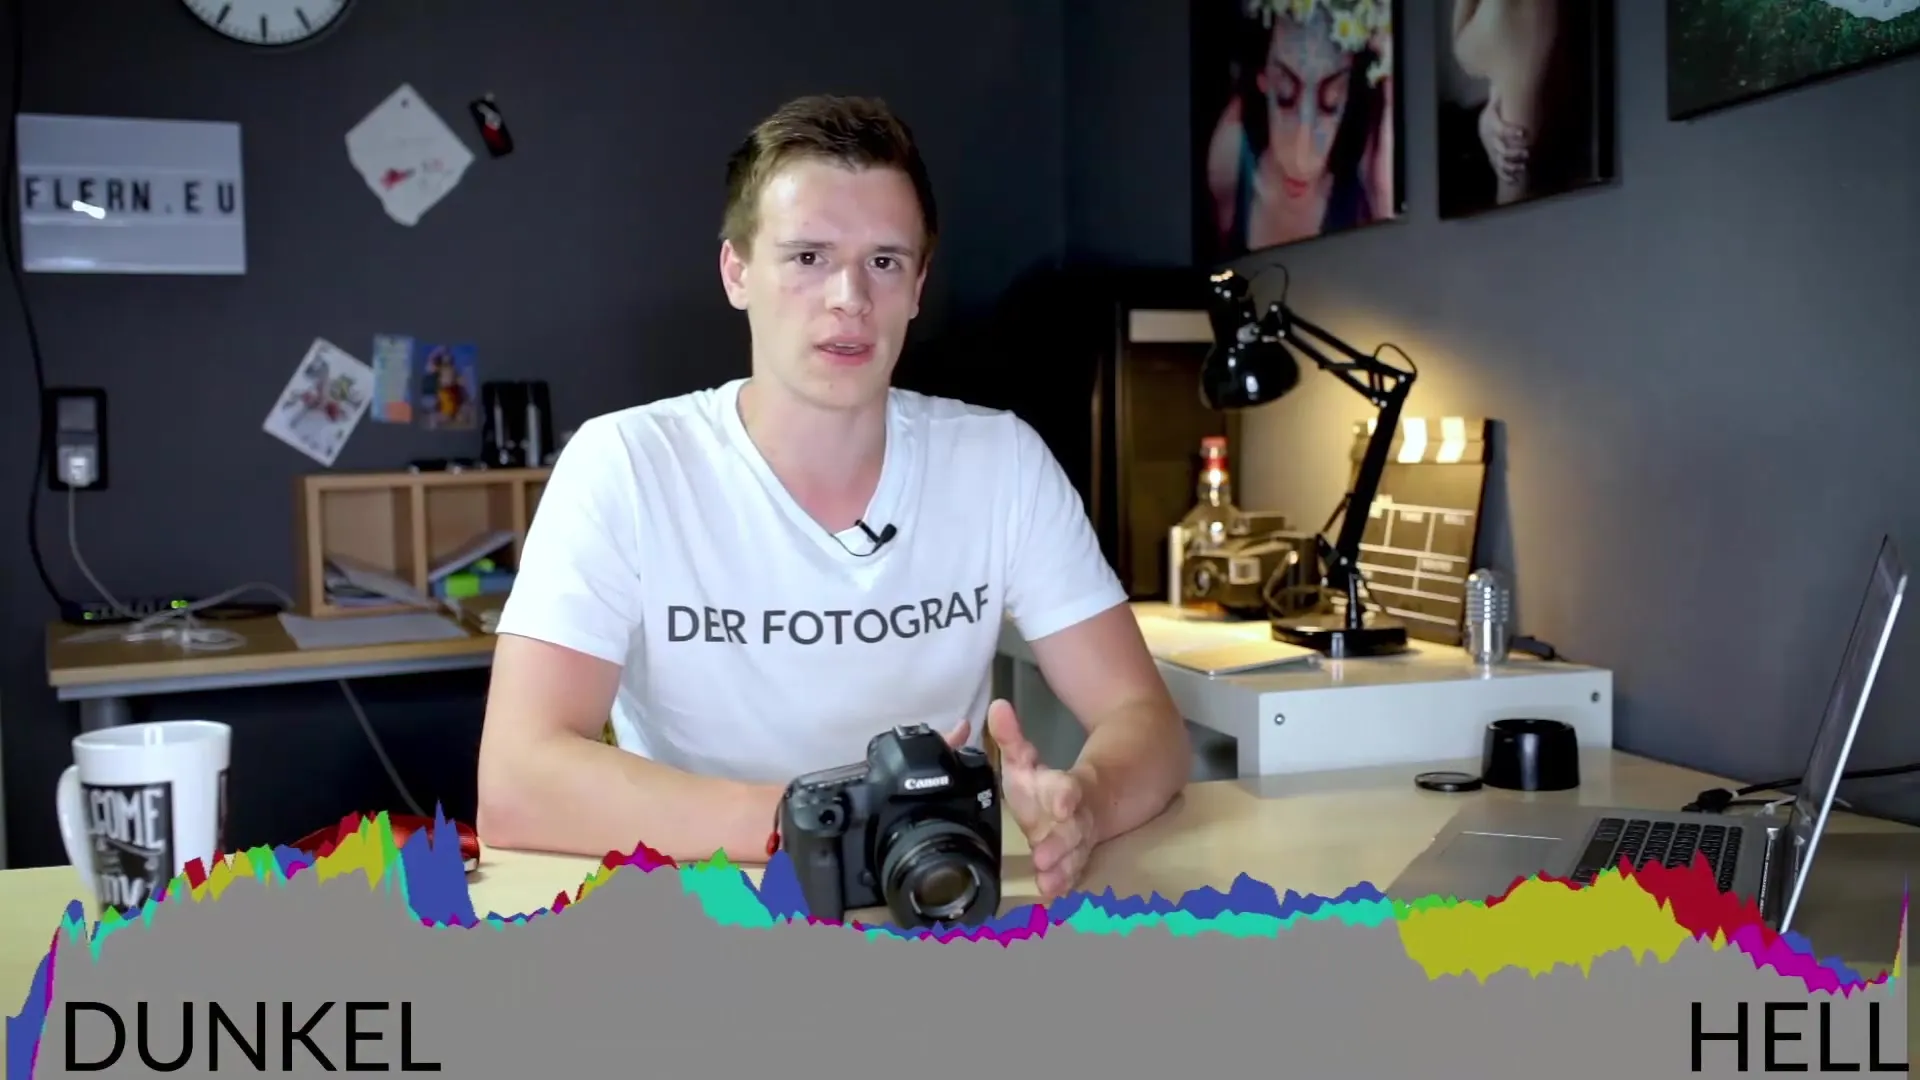
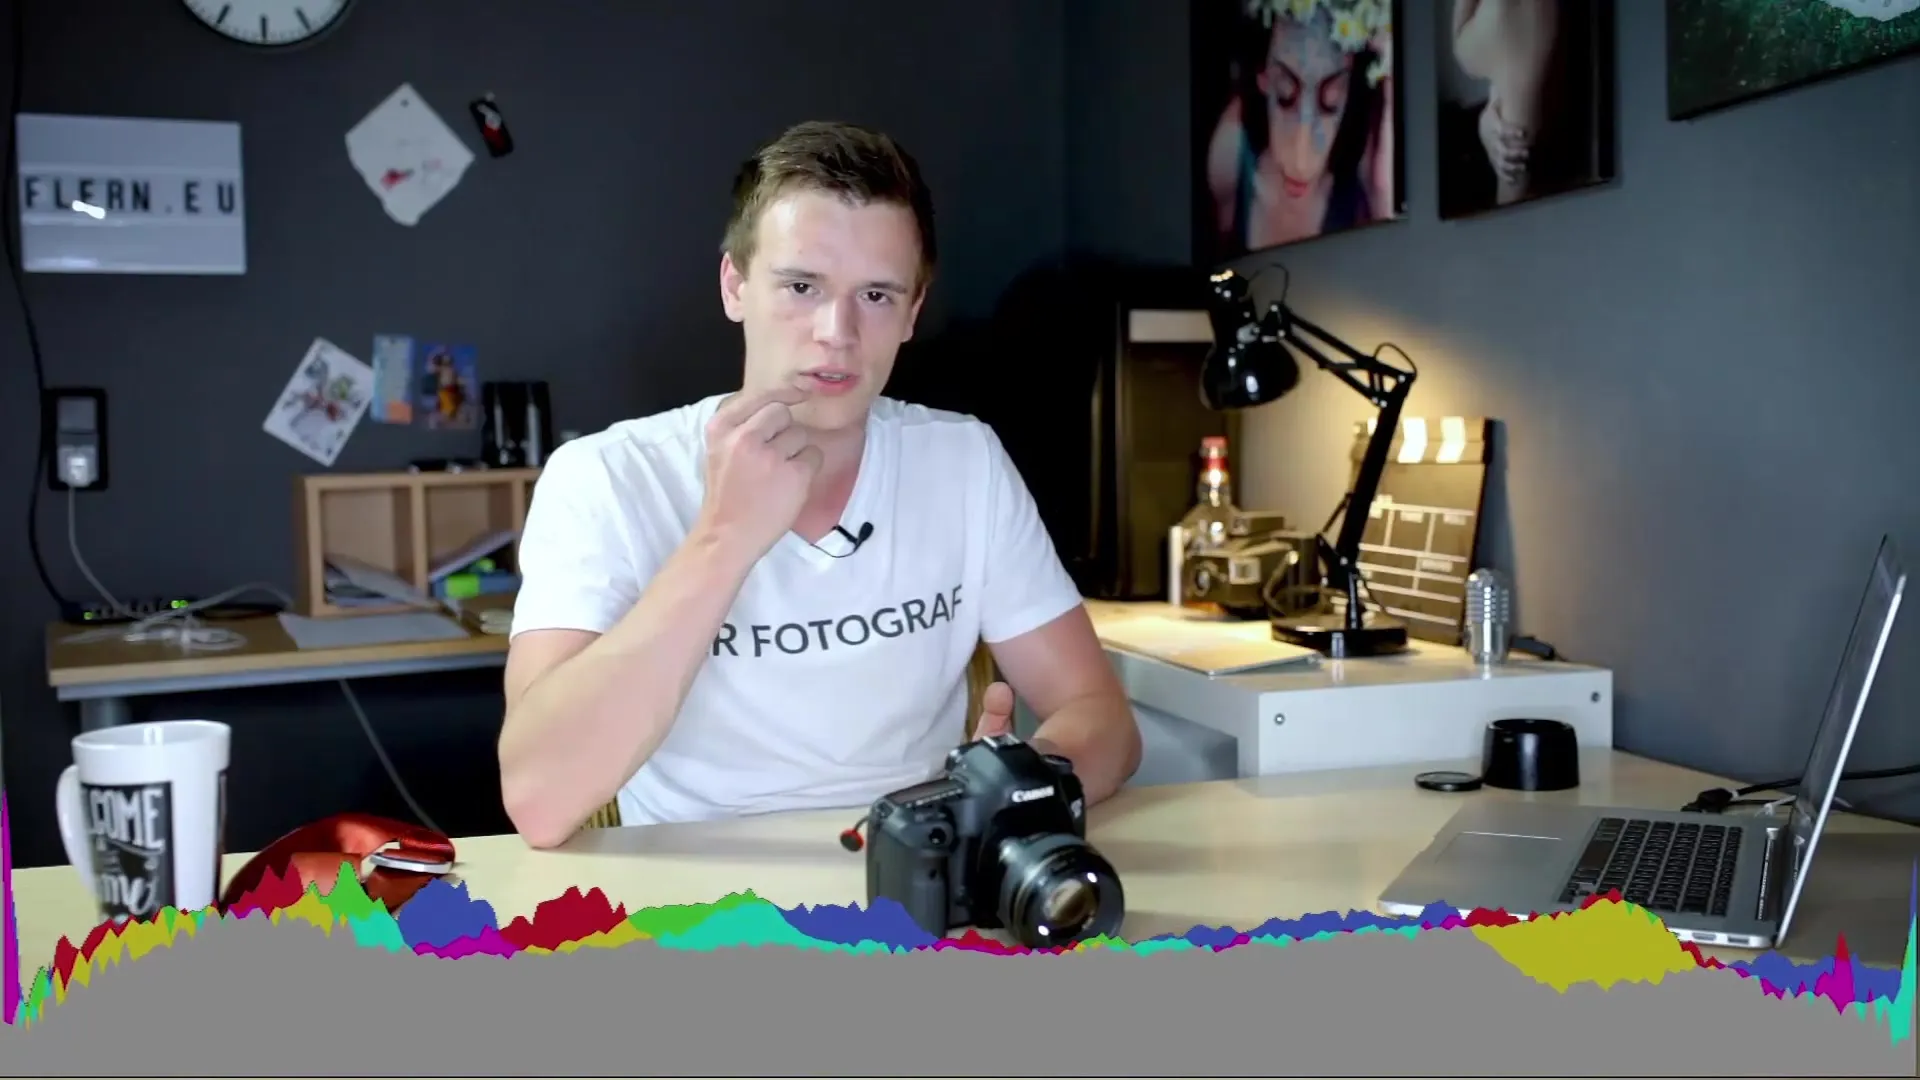
To use the histogram effectively, it is important to understand what it displays. A histogram divides your image into 256 areas – from very dark to very bright. The left side shows the dark areas, while the right side displays the brighter ones. This division helps you quickly recognize brightness distributions in your image.

If you photograph a very bright subject, the histogram will show a high spike on the right. If your image consists only of white, there will be no spikes on the left. Conversely, the same applies to very dark subjects, which will be visible at the left edge of the histogram. The key to using the histogram is that it adapts to the lighting of your subject.

Remember that the histogram tells you where the brightness distribution of your image lies. So, when you take a picture and see an extreme spike, you can easily read where the brightness is. This provides you with valuable information to optimize the exposure of your photos.
Applying the Histogram in Practice
To interpret the histogram correctly, take the time to think about the lighting conditions of your subject. Is the subject evenly lit? Does it consist of many bright or dark colors? The histogram, combined with these considerations, gives you a clear overview of the exposure of your image.
If you are a beginner and are just getting familiar with other camera settings, it can be helpful to initially trust the display of your camera. Just check whether the image looks correctly exposed before delving deeper into the histogram. If you cannot see the histogram on your camera, press the info button or consult your manual to activate it.
One of the best methods to understand how the histogram works is to photograph various subjects under different lighting conditions. Pay attention to what happens when you underexpose or overexpose an image. You will quickly find that the histogram gives you feedback here as well.

When you take a picture and notice that most of the histogram is on the left side, this indicates that the image tends to be dark. Conversely, a high spike on the right side tells you that your image may be overexposed. So there is no single “correct” way to read the histogram; it depends on your subject.
Histogram and Its Limitations
Despite the many advantages that the histogram offers, it is important to emphasize that you should not use it as the sole figure for assessing image quality. A histogram only shows brightness and not color intensity. This means that an image with a "correct" histogram may not look visually appealing.
The histogram is a valuable tool, especially in difficult lighting conditions. For example, when photographing in bright sunlight, the histogram can give you indications of the brightness range you are in, especially when the display of your camera is hard to read.
However, I recommend that beginners not let themselves be unnecessarily unsettled. If you are unsure whether the histogram is providing you with the right information, initially focus on the display of your camera. With some practice and experience, you will be able to integrate the histogram as a supportive tool into your photography.
Conclusion – Understanding the Histogram: The Key to Perfect Exposure in Photography
The histogram is a fascinating tool that can help you optimize the exposure of your photos. By understanding what the histogram indicates and how to read it, you can make informed decisions about the exposure of your images. Follow a path that harmonizes the information from the histogram with your creative style. You will find that you improve with every photograph.
FAQ
What is a histogram?A histogram is a graphical representation of the brightness distribution of an image.
How do I read a histogram?A histogram shows brightness values from very dark (left) to very bright (right). Higher spikes mean more brightness in that area.
Why should I use my histogram?It helps you to detect possible overexposures or underexposures and gives you a better feel for the exposure of your images.
Can I rely solely on the histogram?No, the histogram should be viewed as a supporting tool, not as the sole criterion for image quality.
How do I activate the histogram on my camera?Press the info button or consult your camera manual to display the histogram.


