The histogram is a fundamental tool in photo editing that helps you understand and optimize the tonal distribution of your images. In this tutorial, you will learn how to use the histogram in DxO PhotoLab correctly to assess the quality of your photos and make targeted adjustments.
Key Insights The histogram shows the distribution of tones in your image by visualizing the dark, mid, and light areas. You will learn how to interpret the histogram and how to make adjustments to ensure your images are optimally exposed.
Step-by-Step Guide
1. Accessing the Histogram
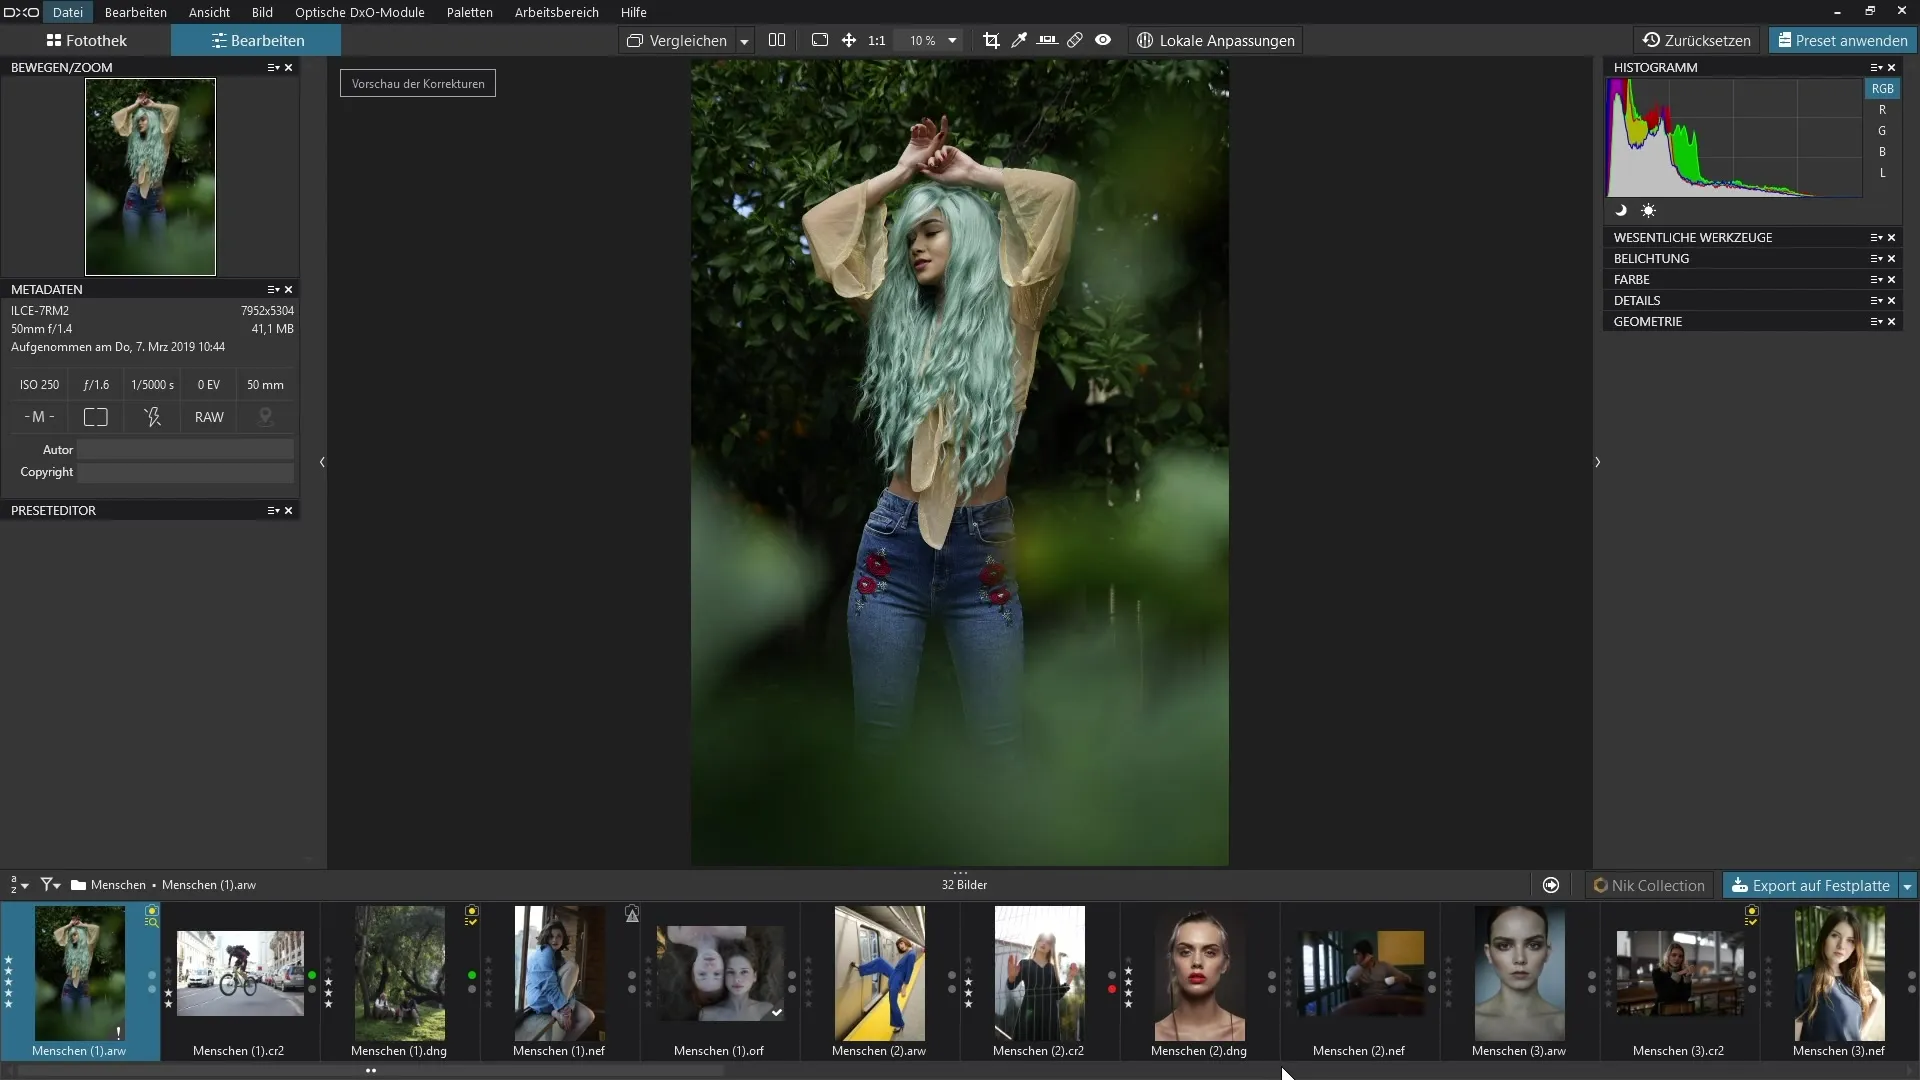
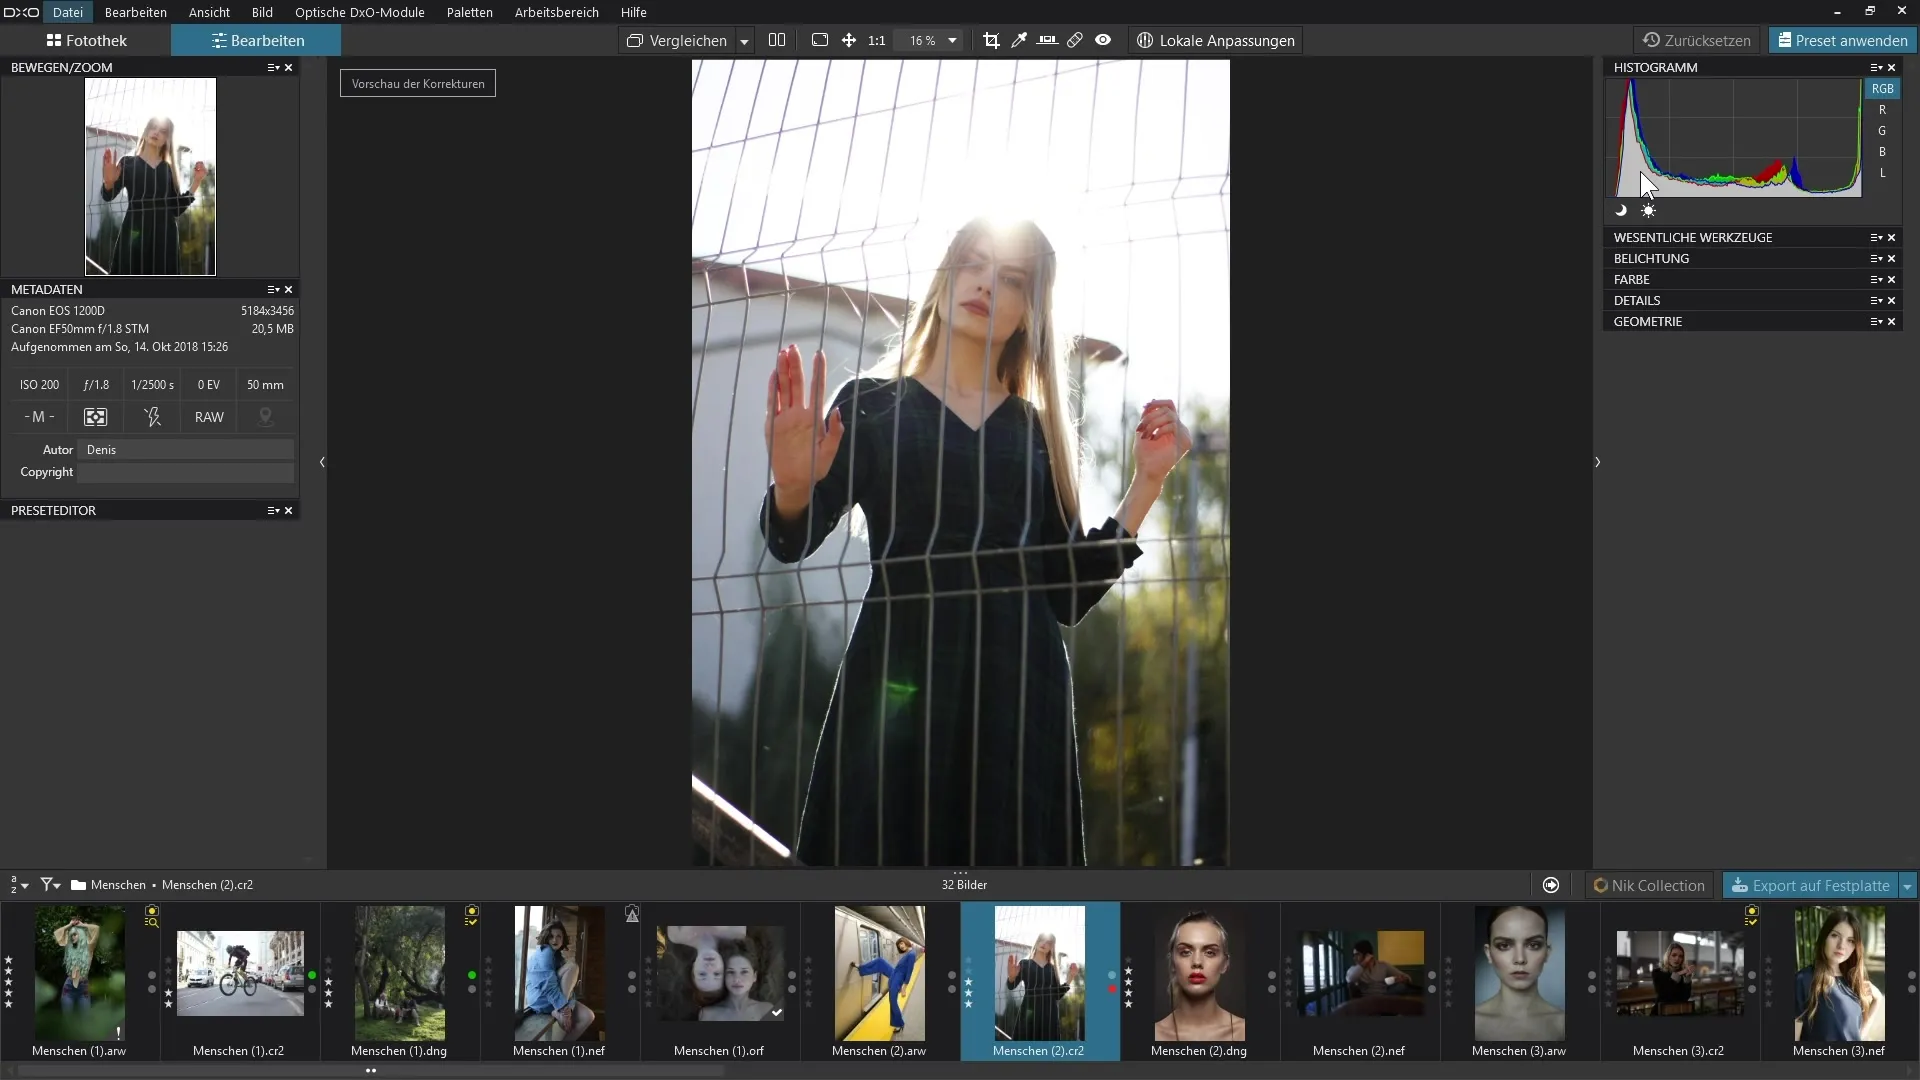
To display the histogram, switch to the editing mode of DxO PhotoLab. Look for the histogram at the top of the panel on the right. It is a separate panel that you can toggle on or off as needed.

2. Understanding Tone Distribution
The histogram displays the tone distribution of your current image. On the left side, you see the dark tones, while the right areas represent the light tones. The middle contains the mid tones. Based on this representation, you can assess how well an image is exposed.
3. Analyzing the Tones
For example, if you look at an image and notice that many pixels are located in the darker areas, it means that the image has a lot of shadows. In some cases, there may be hardly any light areas in the image, which is clearly shown by the histogram.
4. Utilizing Color Channels
The histogram allows you to view the tones in the individual color channels (Red, Green, Blue). By activating the channels, you can more accurately determine which colors in the image may be clipped. This way, the image can potentially be adjusted more specifically.
5. Recognizing Clipping
An important feature of the histogram in DxO PhotoLab is the representation of clipping. Enable the option for clipped highlights and shadows to see if there is a loss of detail in the extreme areas of your image. These will be displayed in false colors to help you identify problematic areas.
6. The Impact of Clipping on Image Quality
Note that you should pay attention to avoid clipped areas during editing. If elements in the image are too dark, they may only be represented in deep black when printed, leading to unpleasant results. Check the different channels to ensure that all details are retained.
7. Assessing Exposure and Details
When an image is well-lit, the histogram usually shows a sort of hump. In these images, there are fewer strong shadows and extremely bright highlights, but instead, the tones are more in the mid-tones. A uniform histogram indicates a harmonious exposure.

8. Refinement through RAW Data Editing
When editing RAW images, you can often make further adjustments for an optimal result. The data gives you more leeway to bring out contrasts and details.
9. Information from the Histogram
Move your mouse over your image to see additional information below the histogram. Here you can check the maximum color values for Red, Green, and Blue. Make sure that all colors are well-balanced to ensure optimal image quality.
10. Completing the Editing
After making all the necessary adjustments, you should check the histogram again. Make sure that there are no more clipped areas and that the exposure is balanced in the desired tone values. A well-edited image should have a balanced histogram.
Summary - Histogram in DxO PhotoLab: Mastering the Tone Distribution of Your Images
In this tutorial, you learned how important the histogram is for assessing the tone distribution in your images. With the steps described, you can analyze and optimize the exposure and color distribution of your photos purposefully.
Frequently Asked Questions
How can I display the histogram in DxO PhotoLab?You can find the histogram at the top of the right panel in editing mode.
What does the histogram show me?It shows the distribution of dark, mid, and light tones in your image.
How do I recognize clipping in the histogram?Enable the option for clipped highlights and shadows to see them displayed as false colors.
Why is clipping problematic?Clipping can lead to a loss of detail, making parts of the image invisible in print output.
How do I know if my image is well-exposed?A well-exposed image usually shows a balanced histogram that predominantly displays mid-tones.


