
So far, you have probably worked in Google Opal mainly with texts that you entered directly. The real strength of automation, however, only shows when you integrate your own data sources. These can be text files, spreadsheets, or documents such as PDFs. That is exactly what this guide is about. You will learn how to upload data, have the AI filter it, and output the results as a clear table or HTML page. Using a customer rating table as an example, I will show you each step.
The video is only loaded from YouTube when you play it – data (including your IP address) is then transmitted to YouTube/Google. More in the privacy policy
Key Takeaways
- External data such as meeting notes, Excel spreadsheets, customer data, or text documents can be integrated directly into Opal. Manual copying is no longer necessary.
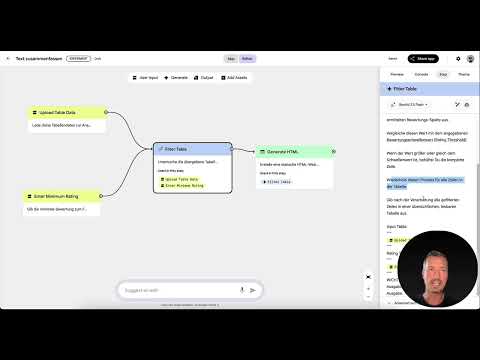
- For tables, there is the input field "Upload Table Data". There you upload a file and define the filter parameters.
- The AI recognizes the rating column even if it is named differently. You should still describe the logic clearly.
- A log file helps you with quality assurance because you can trace which rows were taken into account.
- Clean data formats and precise prompts significantly improve the result.
- Always test your workflow first with a few records before processing large amounts of data.
Step-by-Step Guide
Step 1: Select the appropriate input field
Opal offers different input fields for different sources. For tables, you choose the field "Upload Table Data". With it, you upload a table file for analysis. Typical examples are customer lists sorted by a certain ranking, or customer data in which customers gave a rating from 1 to 10. When creating your workflow, make sure you choose the input format deliberately, because it determines how Opal processes the file.

Step 2: Upload the table and set the filter value
After you have uploaded the table, you use the second input field to set the minimum rating from which records should be processed further. If you only want to consider customers with the top score of 10, you enter exactly that value. So you decide yourself how strict the filter should be. The result depends directly on this value, so it is worth taking a quick look at the input before you start the workflow.
Step 3: Have the rating column recognized
Now you describe to the AI what it should look for in the table. The prompt should state that the column containing the ratings is to be identified. If the column is not clearly named "rating", the AI can infer the appropriate column from the context. This is helpful because in practice, headings in Excel spreadsheets are often changed without the information being updated everywhere. The AI then checks values and patterns. If there is only one column with numbers from 1 to 10, it usually recognizes it as the rating. A consecutive ID, on the other hand, is generally recognized as such and excluded.

Step 4: Compare each row with the threshold
In the next part of the prompt, you specify that the AI reads the value of each row from the identified rating column and compares it with the specified threshold. If the value is greater than or equal to the threshold, the entire row is retained. The AI repeats this process for all rows of the table. You do not have to check every detail yourself, but you should formulate the rule clearly. An instruction such as "Repeat the process for all rows" ensures that no row is really skipped.
Step 5: Create a log file for quality assurance
So that you can verify the results, a log file is recommended. You can ask the AI to additionally record which rows or columns were taken into account. This way you can immediately see whether everything was processed correctly. A cross-check is equally useful: count in your original table how many records meet the criteria, and compare this number with the AI's result. If both values match, you can rely on the workflow.
Step 6: Output the filtered rows as a clear table
After processing, Opal should output all filtered rows in a easily readable table. Here you define the output format in the prompt. It is important that the desired threshold is entered in the "rating Threshold" field and that you do not forget the note on the filter logic. The table is the basis for all further steps, so it should be complete and clearly structured.

Step 7: Generate an HTML Output
As the final output step, you can have a static HTML web page created that displays the table data. Alternatively, you could also pass the results to Google Sheets or a similar tool. In the example in the video, I choose the HTML option. The page displays the data directly in a table, so you can see the result immediately in your browser. This also makes it clear how useful processing external files can be in everyday life.

Step 8: Keep Input Data Clean and Phrase Prompts Precisely
The AI can compensate for a lot, but not everything. Formatting errors, incorrect umlauts, or inconsistent structures make the analysis more difficult. So make sure you have clean datasets with a clear structure. The more clearly your table is structured, the better the result will be. It also helps to address the data context in the prompt. An example would be: "Analyze the Comments column in this table and summarize the main topics." Also add a note that all columns should be taken into account and that the relevant columns should be analyzed precisely.

Step 9: Test the Workflow with a Few Datasets
Before you process large amounts of data, test your workflow with a small table. Copy your original file or create a new sample table with four to five datasets that contain different values. This way you can spot errors quickly and fix them in a targeted manner. Only when the result is correct do you run the workflow with the complete data set. If you need to make adjustments later, start on a small scale then as well.

Summary – Integrating External Data into Google Opal: Automatically Filter and Analyze Tables
You have seen how to integrate external data into Google Opal, upload a table, and have it filtered by a rating. You have also learned how to output the results as a structured table or HTML page and check the quality with a log file. Pay attention to clean data formats, phrase your prompts precisely, and always test each workflow first with a few datasets. The next chapter deals with the limits of Opal. There you will clarify where the tool reaches its limits and whether this restricts you in your daily work.
FAQ
Which data sources can I integrate into Google Opal?You can use text files, tables, and documents such as Google Docs or PDFs as input. Typical examples are meeting notes, Excel spreadsheets, customer data, and survey results.
How do I upload a table to Opal?In the workflow, select the input field "Upload Table Data" and upload your table file there. Then you define the other parameters, such as the filter value, in the second input field.
What happens if the rating column doesn't have a clear name?The AI can infer the rating column from the context. It examines the values and patterns in the columns. However, clear column headers significantly improve the result.
What is a log file used for in filtering?A log file shows you which rows or columns the AI took into account. You can compare the information with your original table and thus check the quality of the analysis.
Why should I test my workflow with a small amount of data first?With a small table of four to five datasets, you can find errors quickly. Only when the result is correct is it worth running the workflow with large amounts of data.
Which errors should I avoid in my input data?Avoid formatting errors, inconsistent structures, and incorrect umlauts. The AI can compensate for many inconsistencies, but not all. Clean datasets with a clear structure deliver the best results.

