

Imagine your table of trips grows to several thousand entries, and you want to know who has brought you the most revenue. You answer exactly this question in Access with a select query that sums up the revenue per customer and, in the end, shows you only the top customers. You don't have to be a programmer to do this. With the query wizard and a few settings in Design View, you'll reach your goal quickly.
The video is only loaded from YouTube when you play it – data (including your IP address) is then transmitted to YouTube/Google. More in the privacy policy
The guide takes you step by step through the entire process: from selecting the right fields, through calculating the totals and grouping, to limiting the result list to the top customers.
Key Takeaways
- A totals query summarizes values per customer. This way you see the total revenue instead of individual trips.
- Only unique fields such as trip number and customer number may be included in the grouping. Otherwise, unwanted splits occur.
- With the Top Values property, you can set the number of results, either as a fixed number or as a percentage.
- Sorting in descending order automatically brings the highest-revenue customer to the top.
Step-by-Step Guide
Step 1: Understand the Starting Point
Open your "Fahrten" table. All trips are recorded here, and each row contains a trip number as well as the associated customer number. A customer can have booked several trips, as in the sample data, where customer 3 has three trips. The price is a calculated field that outputs the amount including VAT. If the net price or the tax rate changes, the gross price adjusts automatically. This very price is the basis for your total.

Step 2: Start the Query Wizard
Switch to the "Create" tab in the ribbon and select the Query Wizard. It guides you through the query without you having to open Design View right away. For this task, you need the option for a select query, because you want to retrieve data from a table and then analyze it.

Step 3: Select the Right Fields
In the next dialog, you select the required fields from the "Fahrt" table. Take the trip number, because it uniquely identifies each trip. Add the date, the price, and the customer number. From the "Kunde" table, you also need the customer ID as well as first and last name. This information makes the result readable later, because a bare number tells you less than a name.

Step 4: Check the Uniqueness of the Fields
When selecting fields, make sure that each field is unique. The trip number is unique, as is the price once it is grouped. The customer ID and the customer's name are as well. The date, on the other hand, is not unique, because several trips can take place on the same day. If you select unsuitable fields, Access splits the results into additional rows, and your totals will no longer be correct.
Step 5: Define Sum, Average, Maximum, and Minimum
In the "Summary" step, you specify which values are to be calculated. Access automatically suggests the price. Select "Sum," because you want to see the total revenue per customer. The average would be of little help here. A customer with a single large trip could otherwise come out better than a customer with ten small trips, even though the latter has paid more overall. You can additionally enable maximum and minimum if you want to know who spent the most and who spent the least.
Step 6: Avoid Grouping by Date
In the next dialog, Access asks how the date should be grouped. Here lies a typical trap. If you use the date as a grouping field, you get multiple rows for each customer, depending on which day they traveled. Since you only need the total revenue per customer, you remove the date from the grouping. Instead, you set the grouping on the unique fields: trip number, price, customer ID, and first and last name.
Step 7: Finish the Query and Check the Result
Complete the wizard and save the query, for example under the name "Kunden Topsatz". Then open it in Datasheet View. You now see one row per customer with the sum of their trips. It's best to check the result with a quick mental calculation. Customer 1 generated 20 euros, customer 2 14 euros, and customer 3 a total of 40 euros. Since you verify this, you know that the query calculates correctly. The top entry is then customer 3, i.e., Alexander Müller.
Step 8: Set Sorting and Relationships in Design View
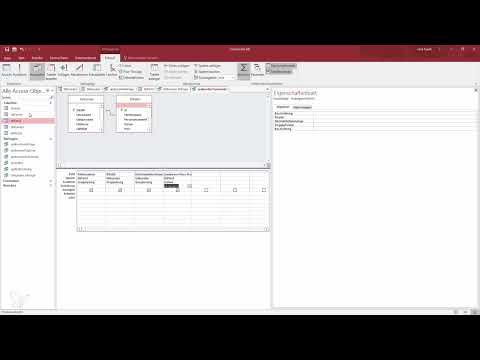
Switch to Design View. There you can see that Access has automatically established the relationship between the "Fahrt" and "Kunde" tables. This is important, because without this link the names could not be assigned correctly. In the grid, set the sorting for the sum column to "Descending". Then the customer with the highest revenue is at the very top.

Step 9: Hide Unnecessary Columns
For your report, you usually don't need the trip number. Hide it by unchecking the "Show" box in Design View. The result then shows only the customer and the sum of the price. This reduction is especially helpful for overviews or mail merges, because the list stays clear.
Step 10: Limit the Number of Results
With large amounts of data containing thousands of customers, you don't want to see the complete list. To limit it, open the query's property sheet by clicking the selection box at the top of the grid rather than on a single column. There you will find the "Top Values" property. Use the "Unique Values" property only if you need to filter out duplicate rows. In this example it is unnecessary, because you are already using unique fields.
Step 11: Choose a Fixed Number or a Percentage
For the top values, you can choose between fixed numbers such as 5, 25 or 100 and a percentage. With 100 customers and 5 percent, you get five customers. With 1,000 customers, 5 percent correspondingly equals 50 customers. For this small example, a fixed number is enough. Choose, for example, the value 3 for the Top 3, and you will see only the three highest-revenue customers.
Step 12: Use the Query for Reports and Analyses
You can use the finished query as the basis for reports. In this way, you create a list of top customers or top drivers with just a few clicks. The same principle also works for personnel statistics. If you record which employee generated how much revenue, you can immediately identify the most dedicated employees through groupings and sums.

Step 13: Distinguish the Property Sheets Correctly
A common mistake is editing the properties of a single column instead of the entire query. In the column's property sheet, you will find settings only for that one field. If you instead click the selection box at the top left of the query window, Access displays the properties of the entire query. You always set the top values there, that is, in the query's property sheet.

Summary – Identifying Top Customers in Access: Summing Revenue and Filtering Top Values
With a select query, a sum calculation and the right grouping, you can quickly identify the customer with the highest revenue in Access. Make sure to use unique fields, avoid grouping by date, and limit the results using the top values. This gives you a clear list that you can use for reports or targeted actions such as special offers.
FAQ
Why shouldn't I group by date?A date is not unique, because a customer may have traveled on different days. Grouping would then produce multiple rows per customer and split up the sum.
What is the difference between sum and average?The sum shows a customer's total revenue. The average shows the average per trip. For the question of who the most important customer is, the sum is usually more meaningful.
Can I also specify the number of results as a percentage?Yes, in the query's property sheet you can enter a percentage value for the top values. Access then displays the corresponding share of the records.
Where do I set the top values correctly?The "Top Values" property belongs to the entire query. You can find it in the property sheet when you click the selection box at the top left of the query design.
Why are names not displayed correctly?Usually the relationship between the tables is missing or the fields are not chosen correctly. Check in Design View whether the link between Fahrt and Kunde exists.

