The visual representation of data is an essential part of software development. In particular, charts are an effective way to illustrate trends and developments over time. In this guide, we will show you how to create a line chart in JavaFX. As an example, we will use the popularity of popular cartoons and their development over the years. You will learn how to set up the line chart, insert data, and customize it to meet your needs.
Key Insights
- Using CategoryAxis and NumberAxis to define the axes.
- Creating XYChart.Series for data input.
- Simply adding data points to the chart.
Step-by-Step Guide
To create a line chart in JavaFX, follow these steps:
Step 1: Defining the Axes
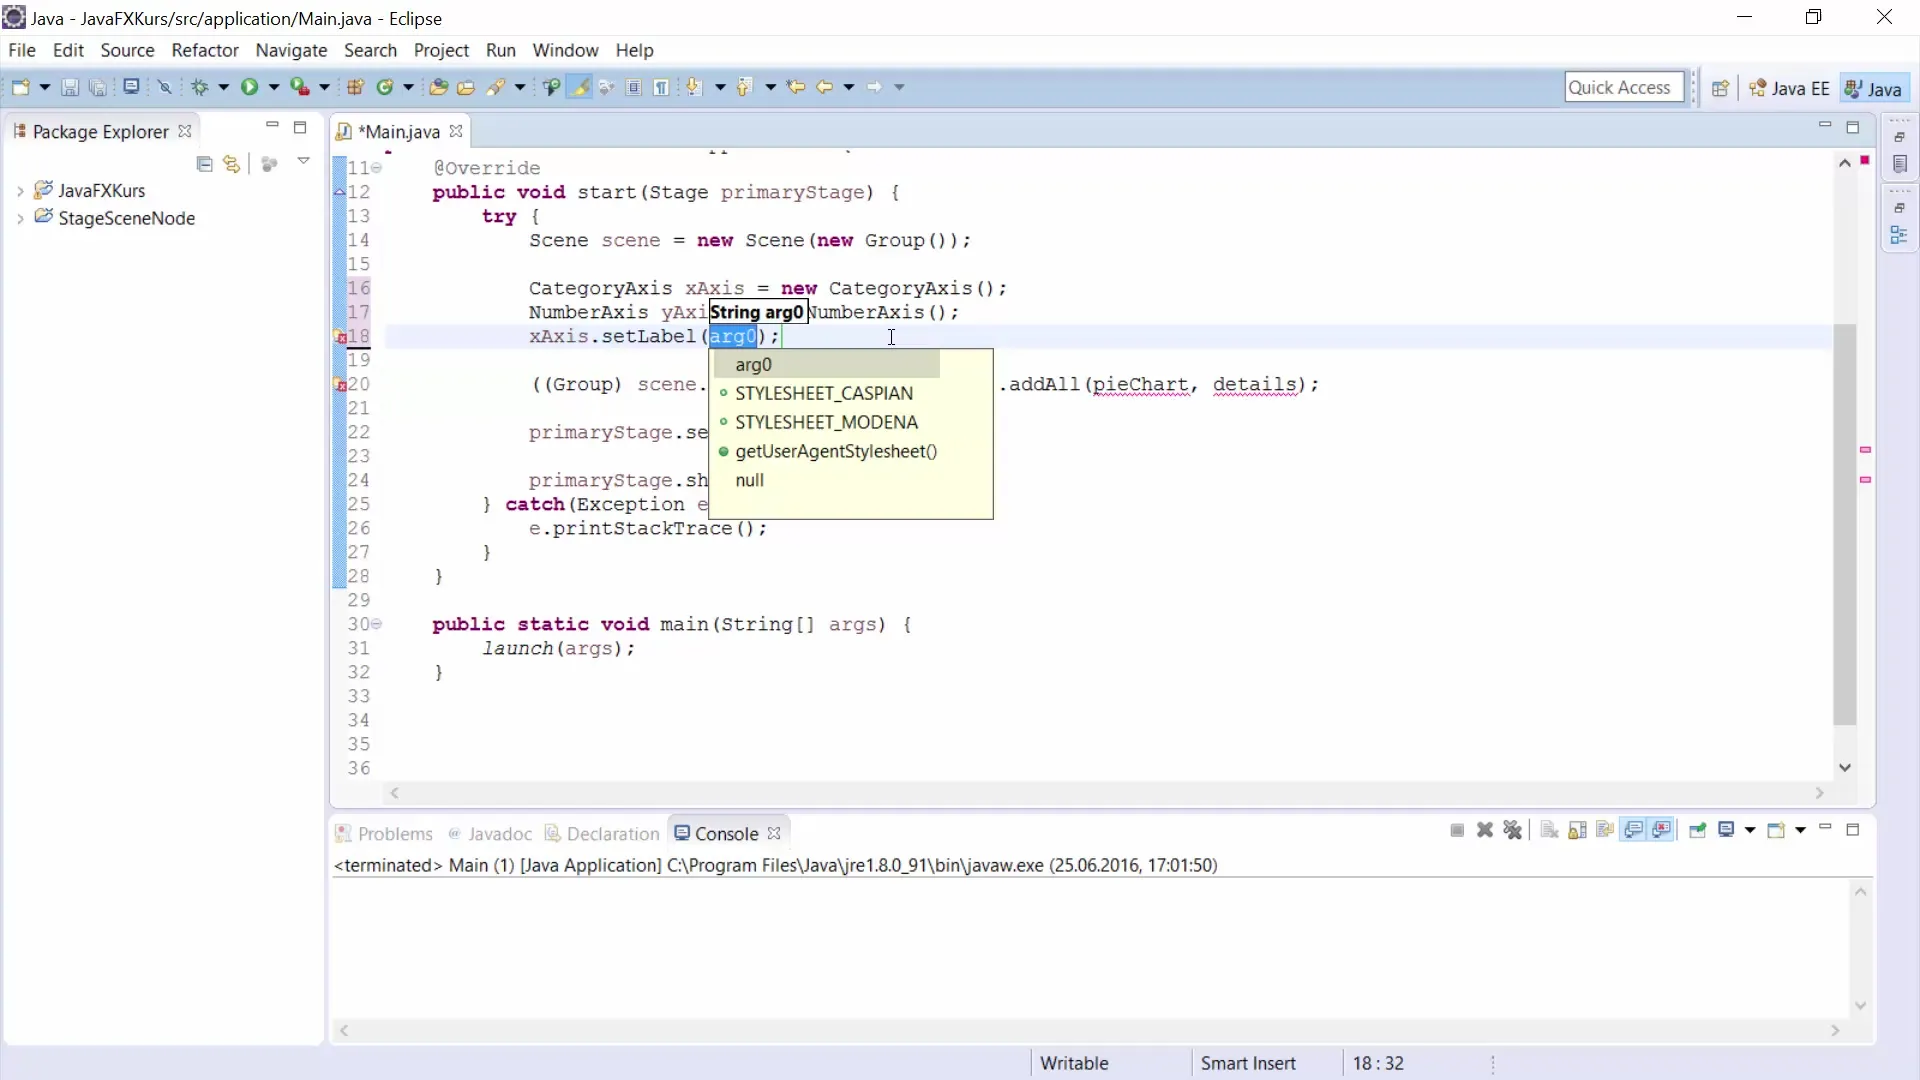
First, you need to define the axes for your line chart. We use a CategoryAxis for the x-axis and a NumberAxis for the y-axis. This defines how the data will be represented.
After creating the axes, you need to assign labels to them to make them more understandable.
Step 2: Creating the Line Chart
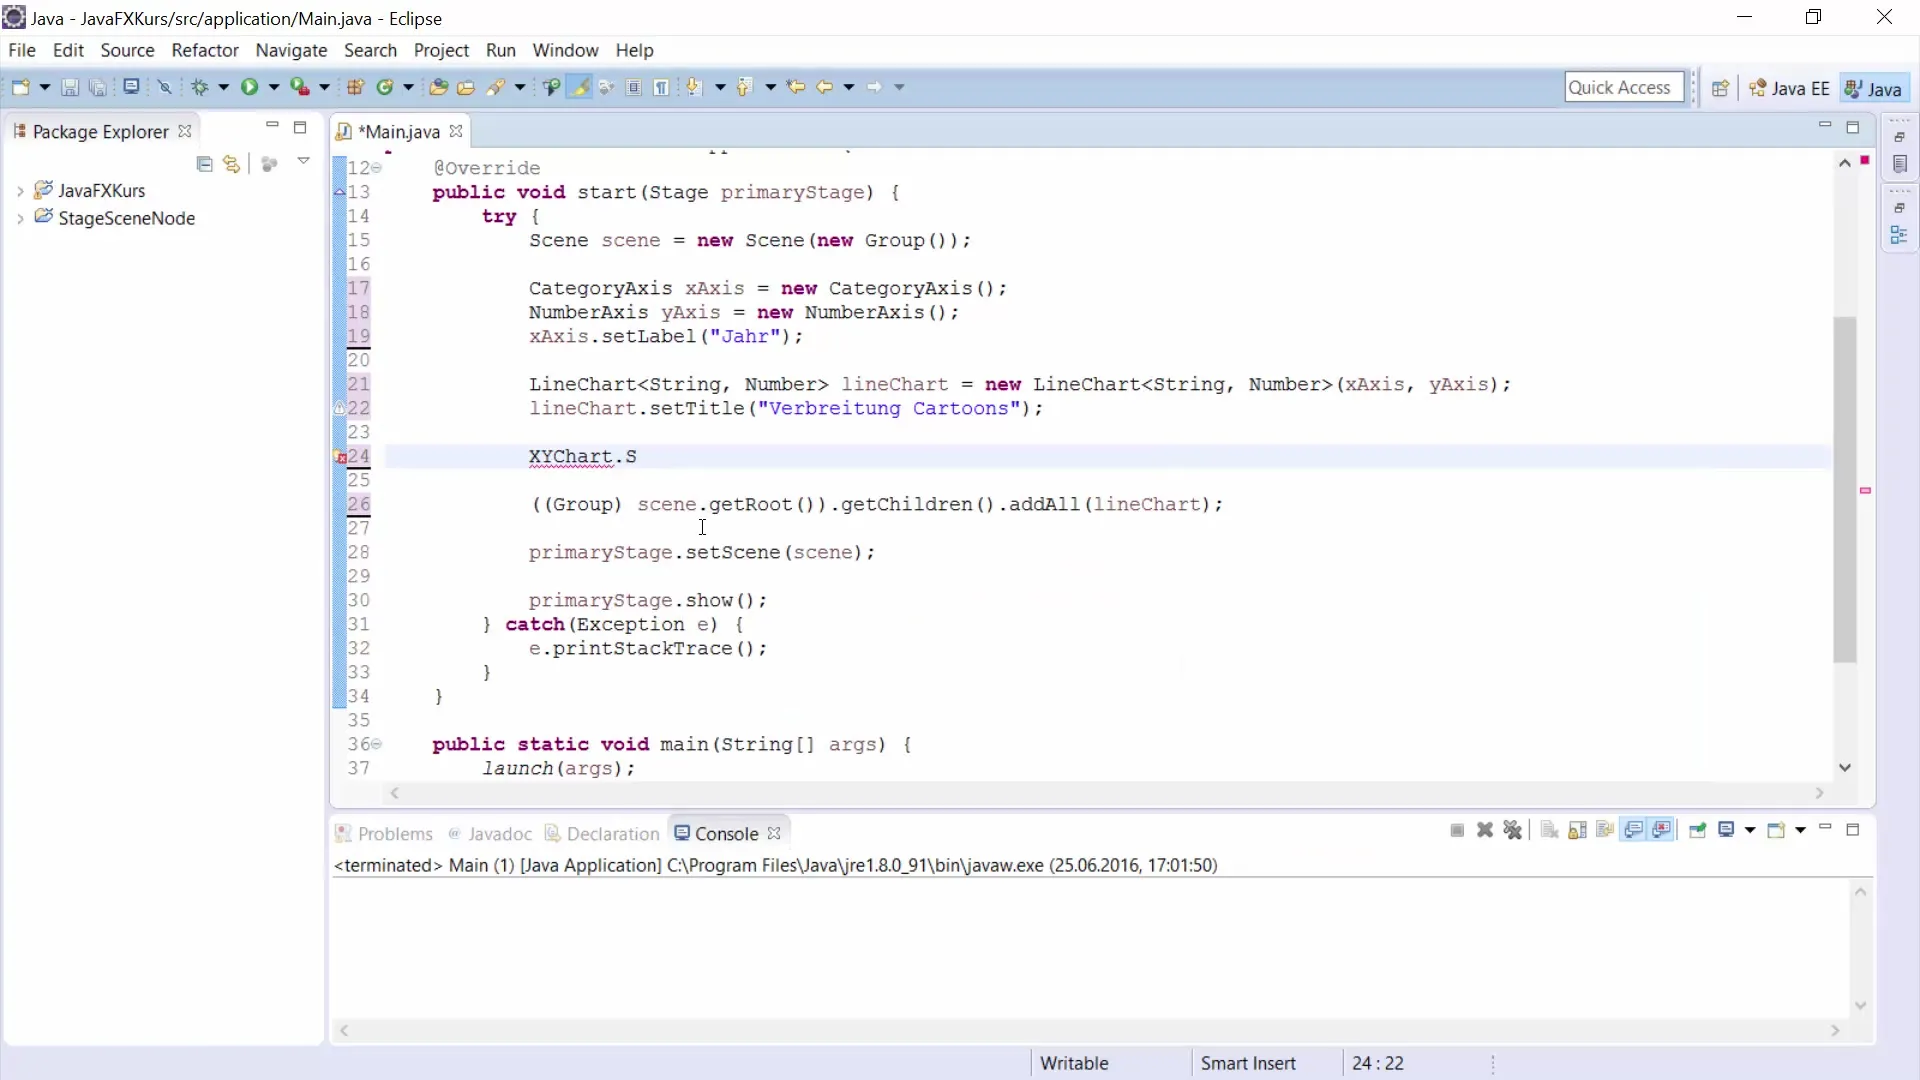
Once the axes are defined, you will create the actual line chart. A LineChart requires the axes you created earlier as parameters.
Step 3: Adding Data Series
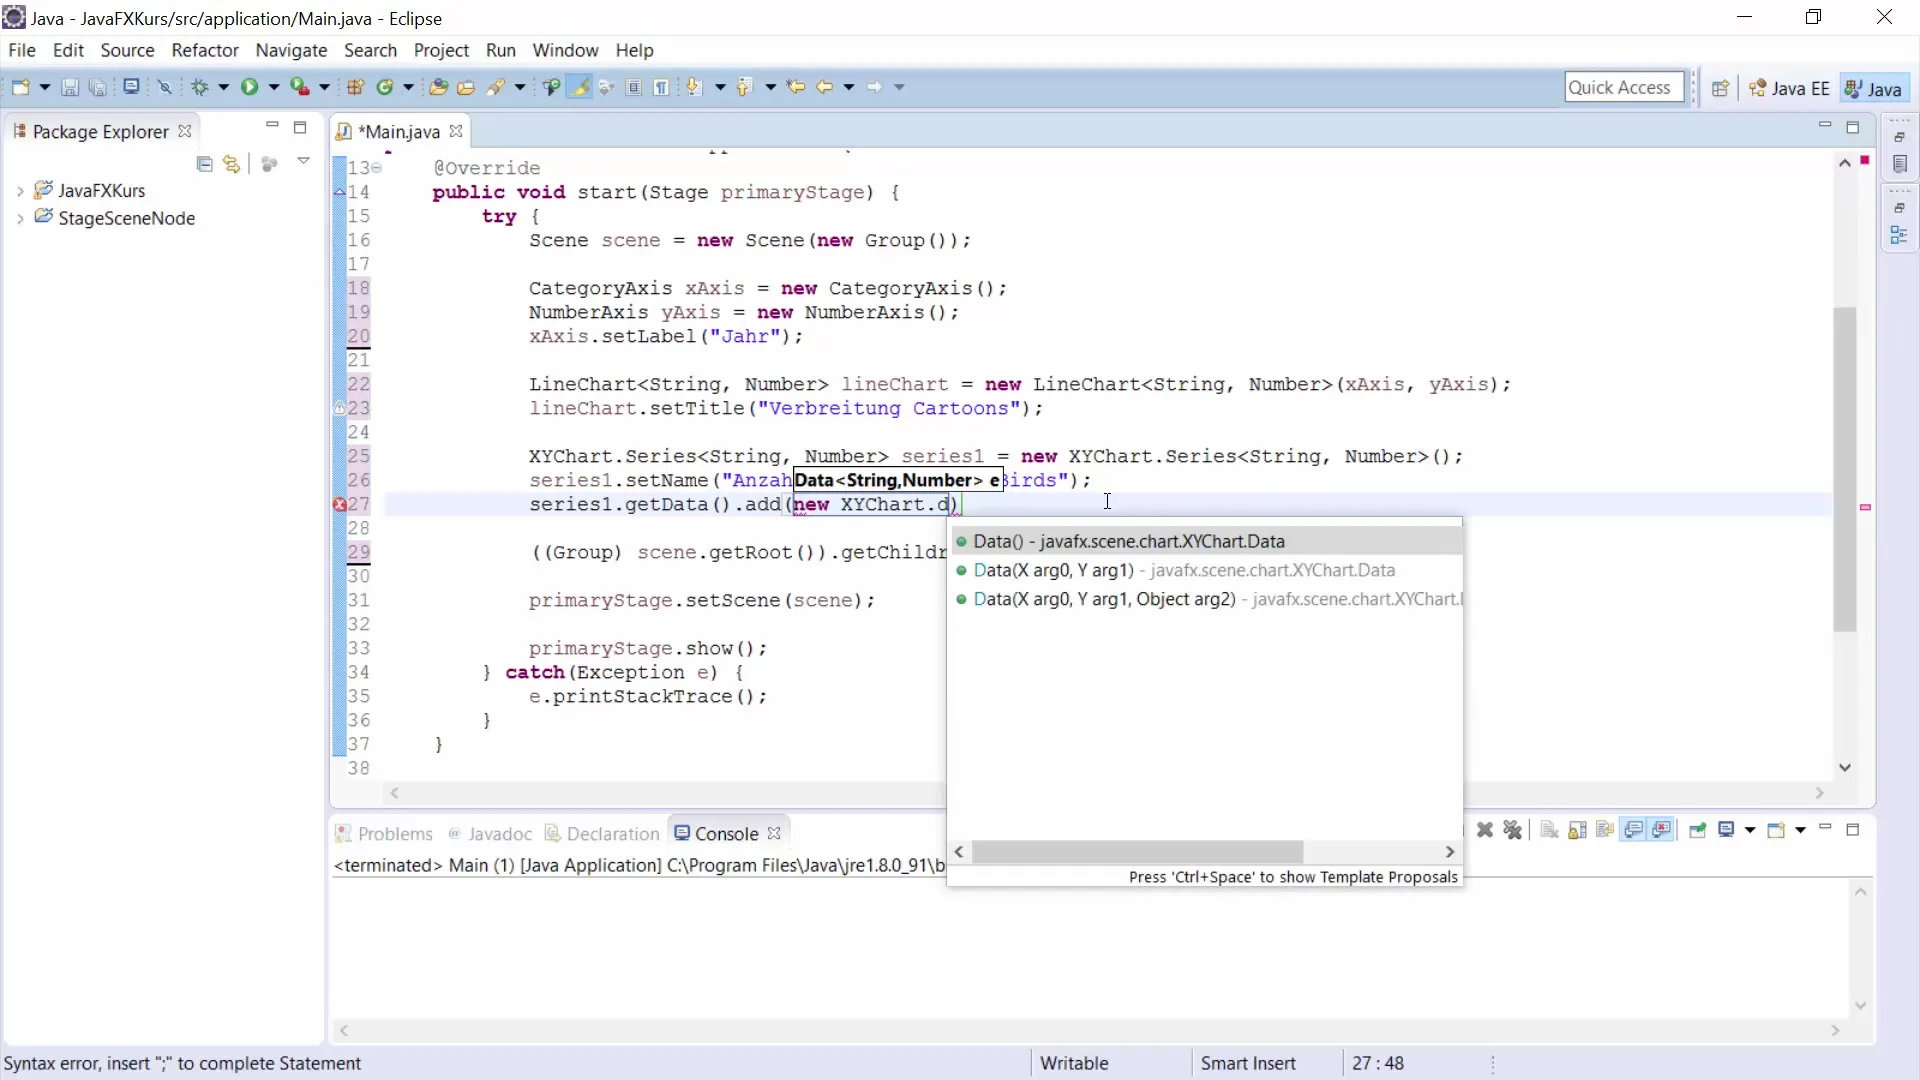
To add data to your line chart, you need to create XYChart.Series. Each series represents a line on the chart.
Then add data. This includes the year as a string and the corresponding number of new cartoons.
Step 4: Inserting the Series into the Chart
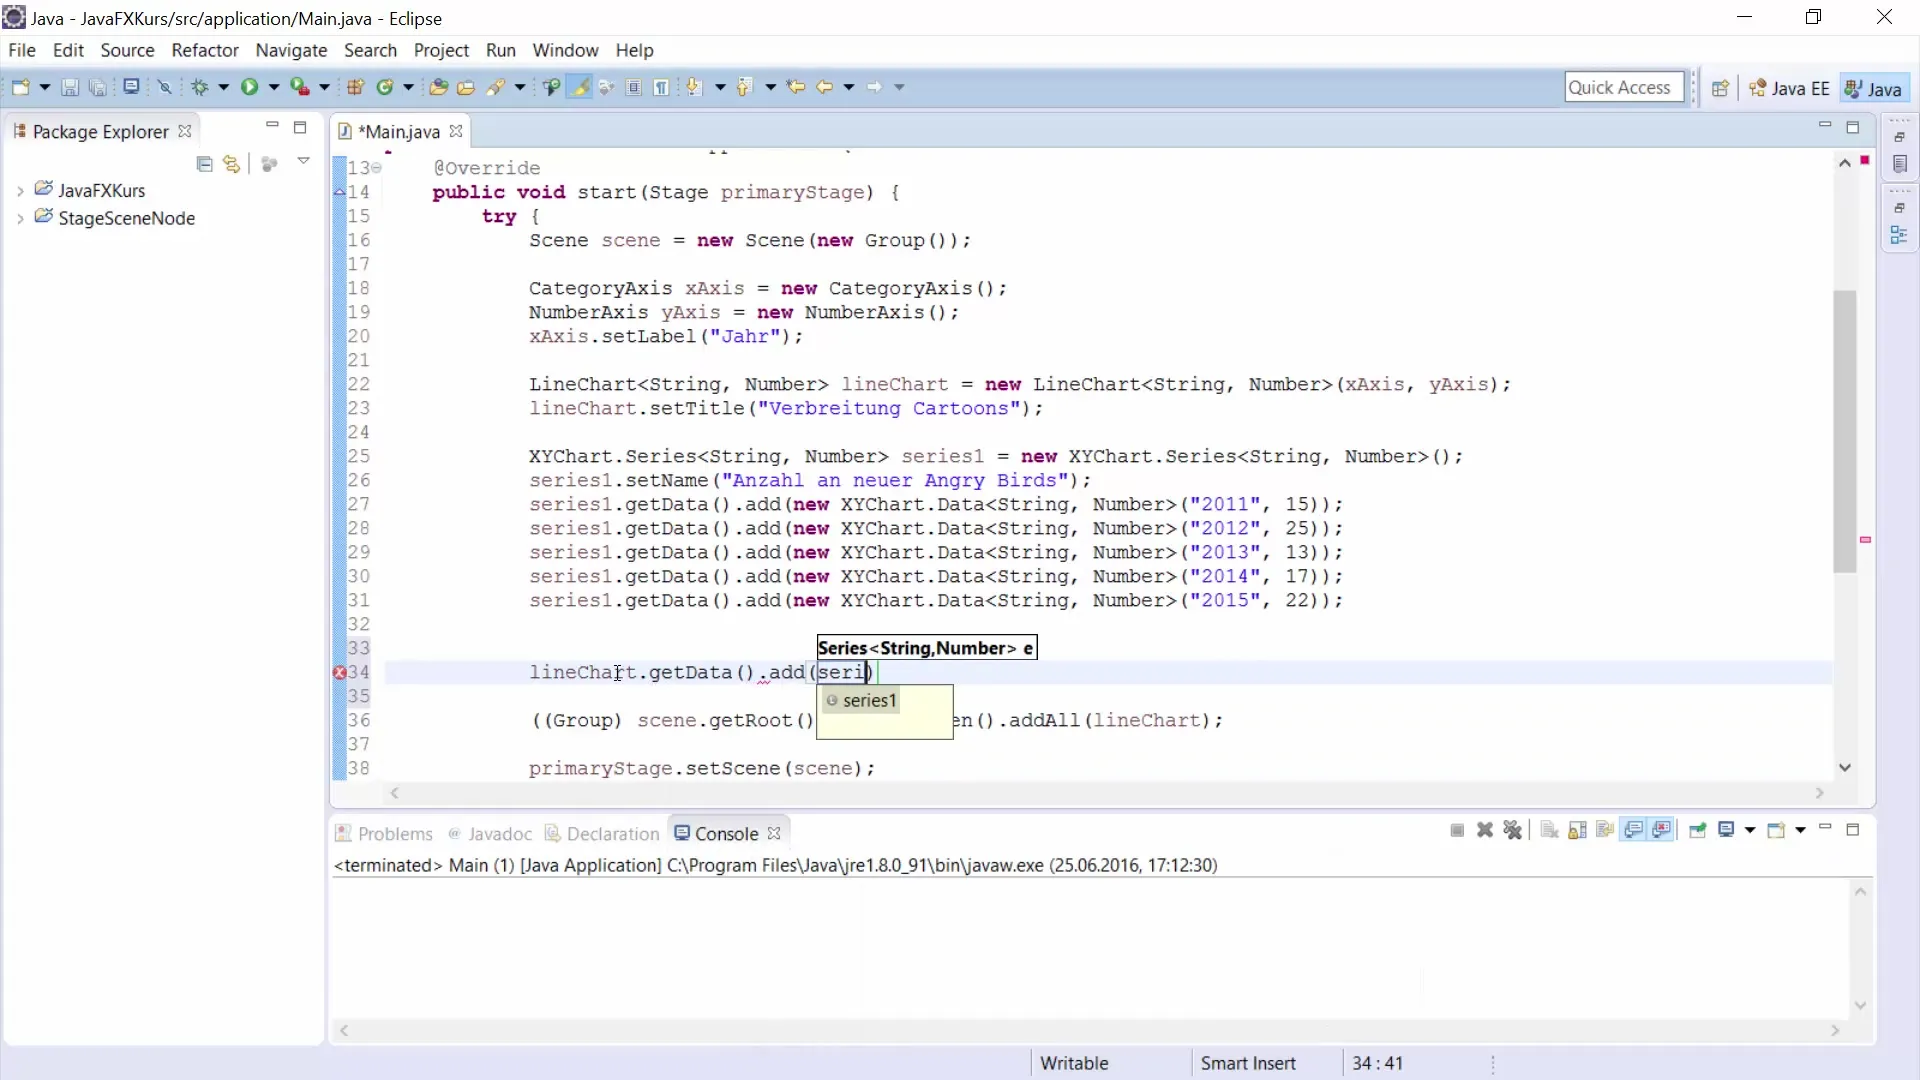
After creating the data series, add it to the line chart.
Step 5: Creating a Second Data Series
Now that you have added a data series, it’s time to add a second series for the Minions. Use the same steps as before to create a new series.
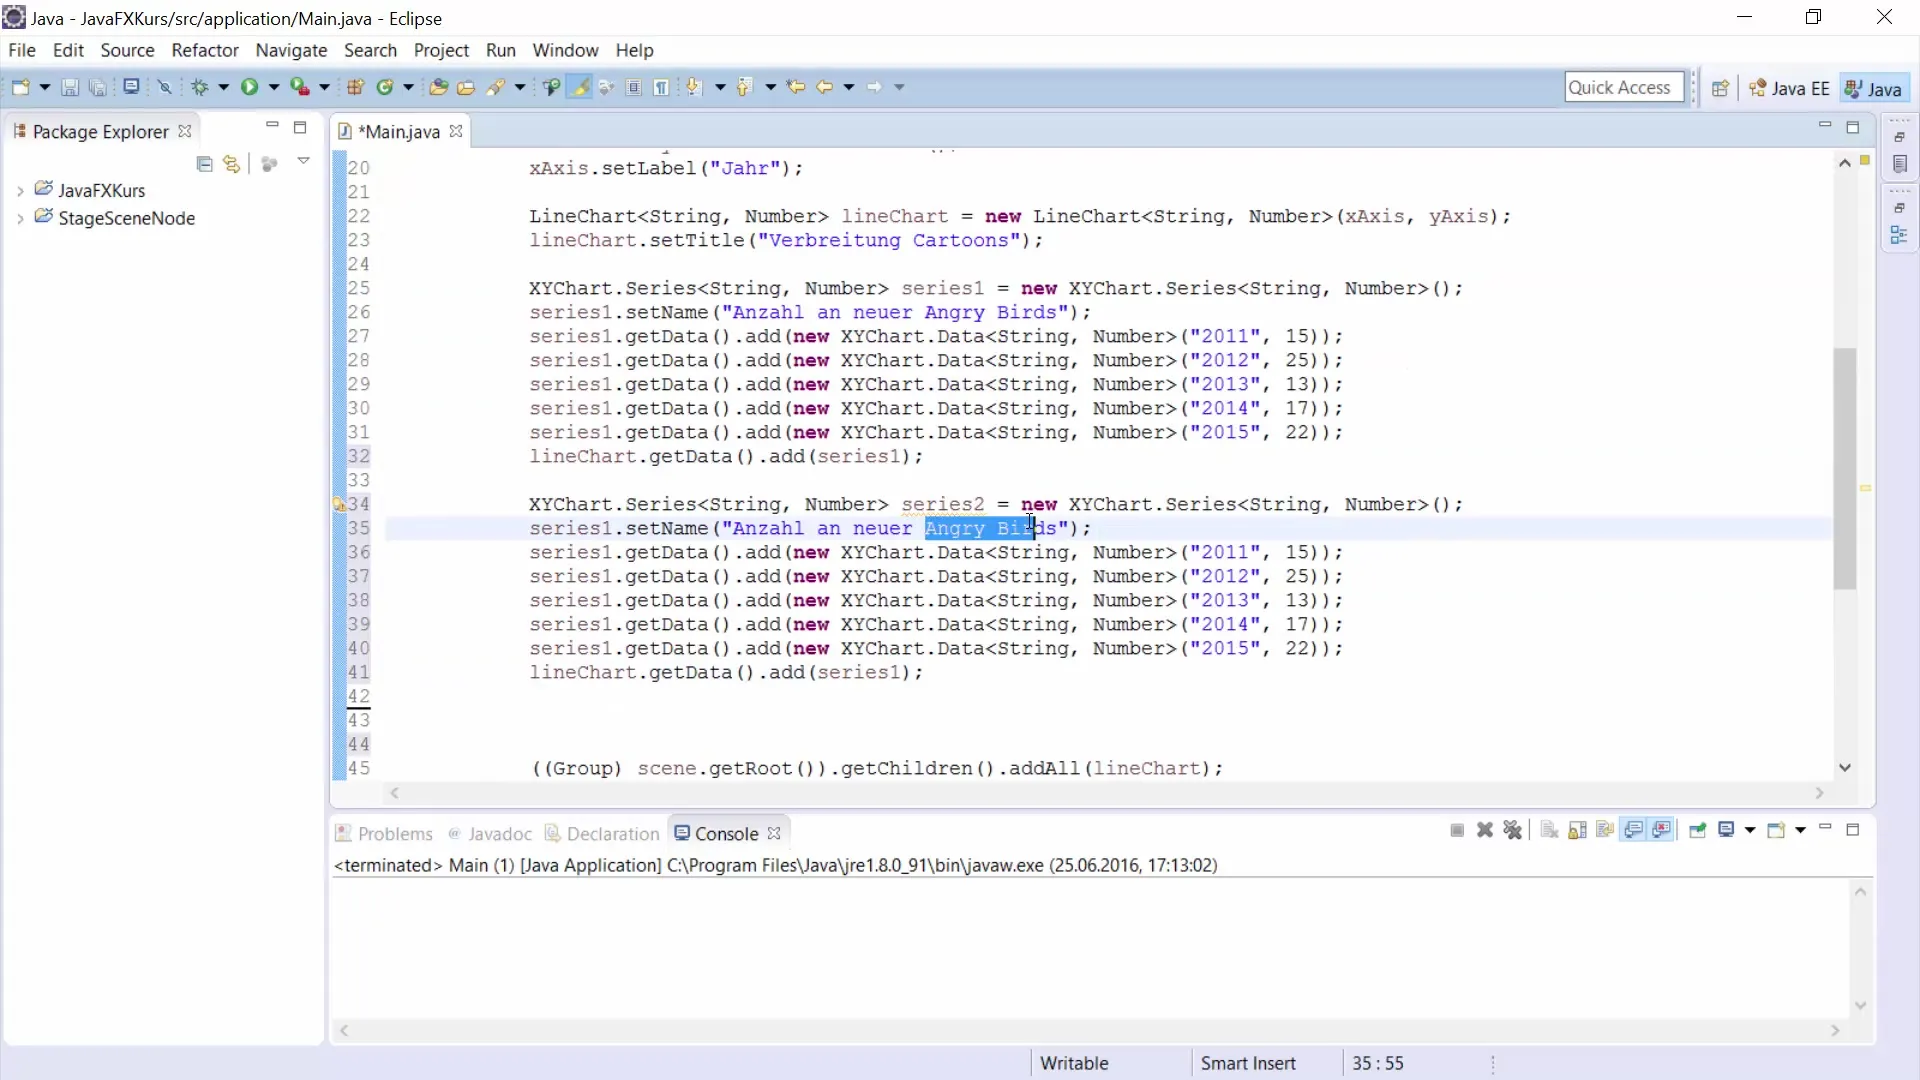
Add data for this series by entering the number of Minions over the years.
Step 6: Inserting the Second Series into the Chart
As with the first series, add the second series to the chart as well.
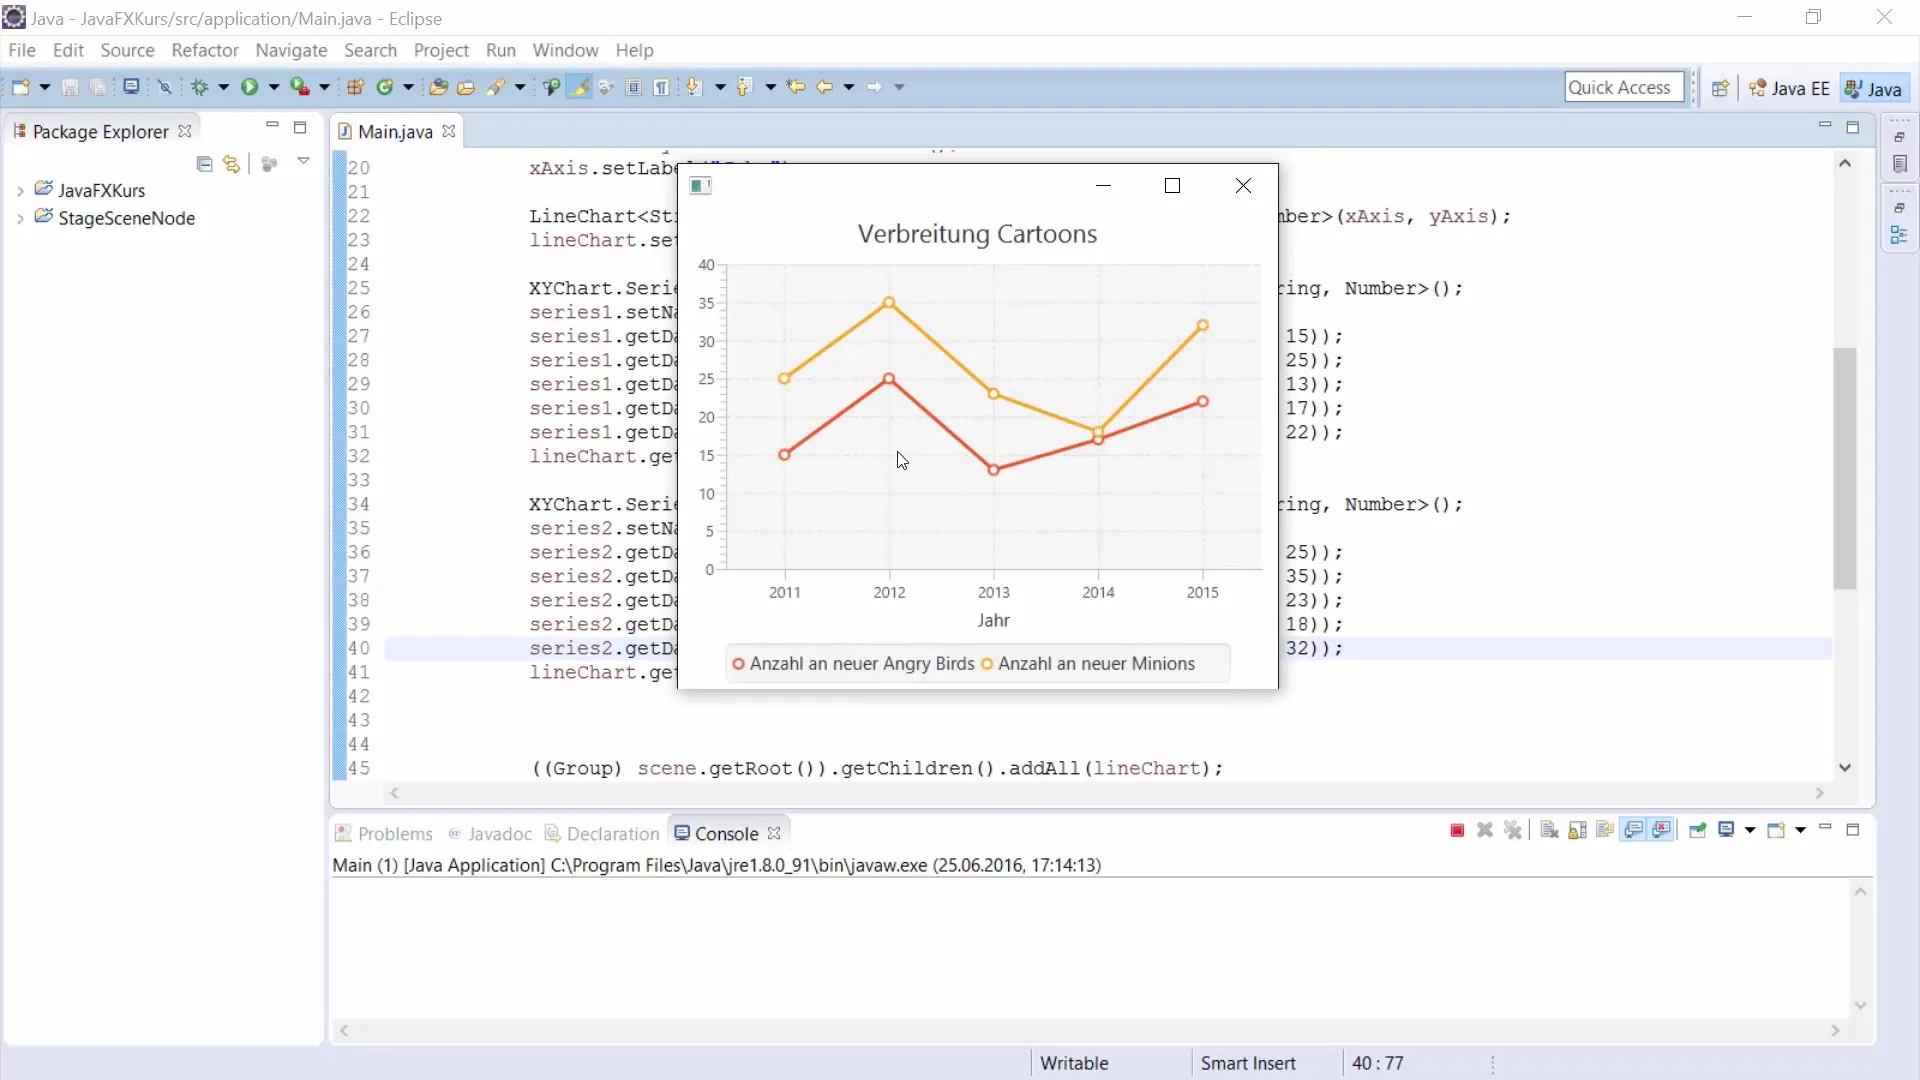
Step 7: Displaying the Chart
Once all elements have been correctly added, you can display your line chart. Make sure your JavaFX window is configured to host the chart.
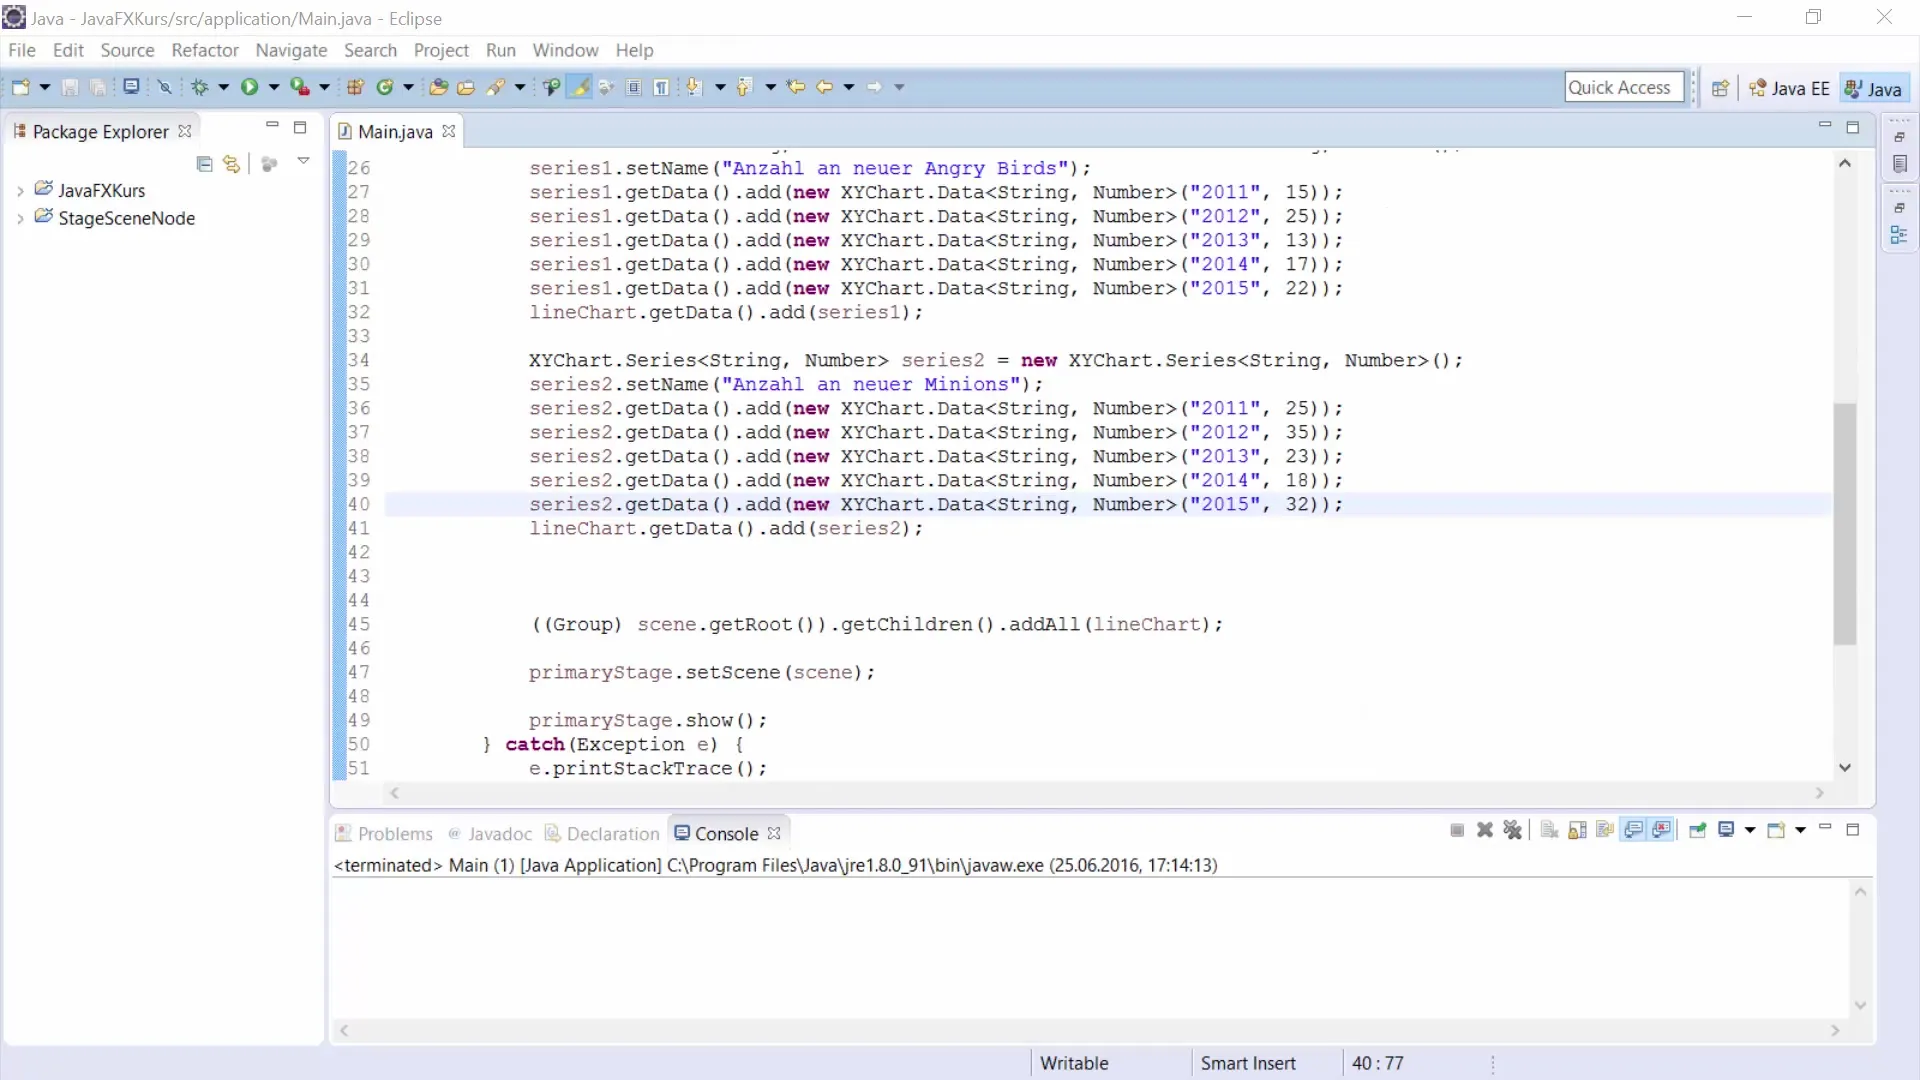
Summary – Creating a Line Chart in JavaFX
In this guide, you have learned how to create a line chart in JavaFX to represent data. We defined the axes, added data series, and finally displayed the chart. With this method, you can easily and effectively create data visualizations that are useful for your applications.
Frequently Asked Questions
What is a line chart?A line chart is a type of chart that connects data points with lines to make trends visible.
How do I add more lines?Each line represents an XYChart.Series, which you can add following the same principle as the first series.
Can I use other chart types?Yes, JavaFX supports many chart types, including bar charts and pie charts.


