The creation of graphical user interfaces (GUIs) is an essential part of software development, and JavaFX provides outstanding capabilities for creating various types of charts. In this guide, we focus on the scatter-chart in JavaFX, which allows you to represent values as unconnected points. Scatter charts are particularly useful for visualizing data distributions and gaining insights into behavioral patterns.
Main insights
- Scatter charts display values as individual points rather than connected lines.
- They are particularly suited for visualizing data distributions, such as on a soccer field.
- By using randomly generated data, you can create interesting heatmaps.
Step-by-Step Guide to Creating a Scatter Chart
1. Introduction to the Scatter Chart
To begin, you should understand what a scatter chart is. It visualizes data points as separate units on a coordinate system, helping you identify patterns or distributions. Your goal is to create a heatmap that shows how different points behave in a given space.
2. Setting the Axes
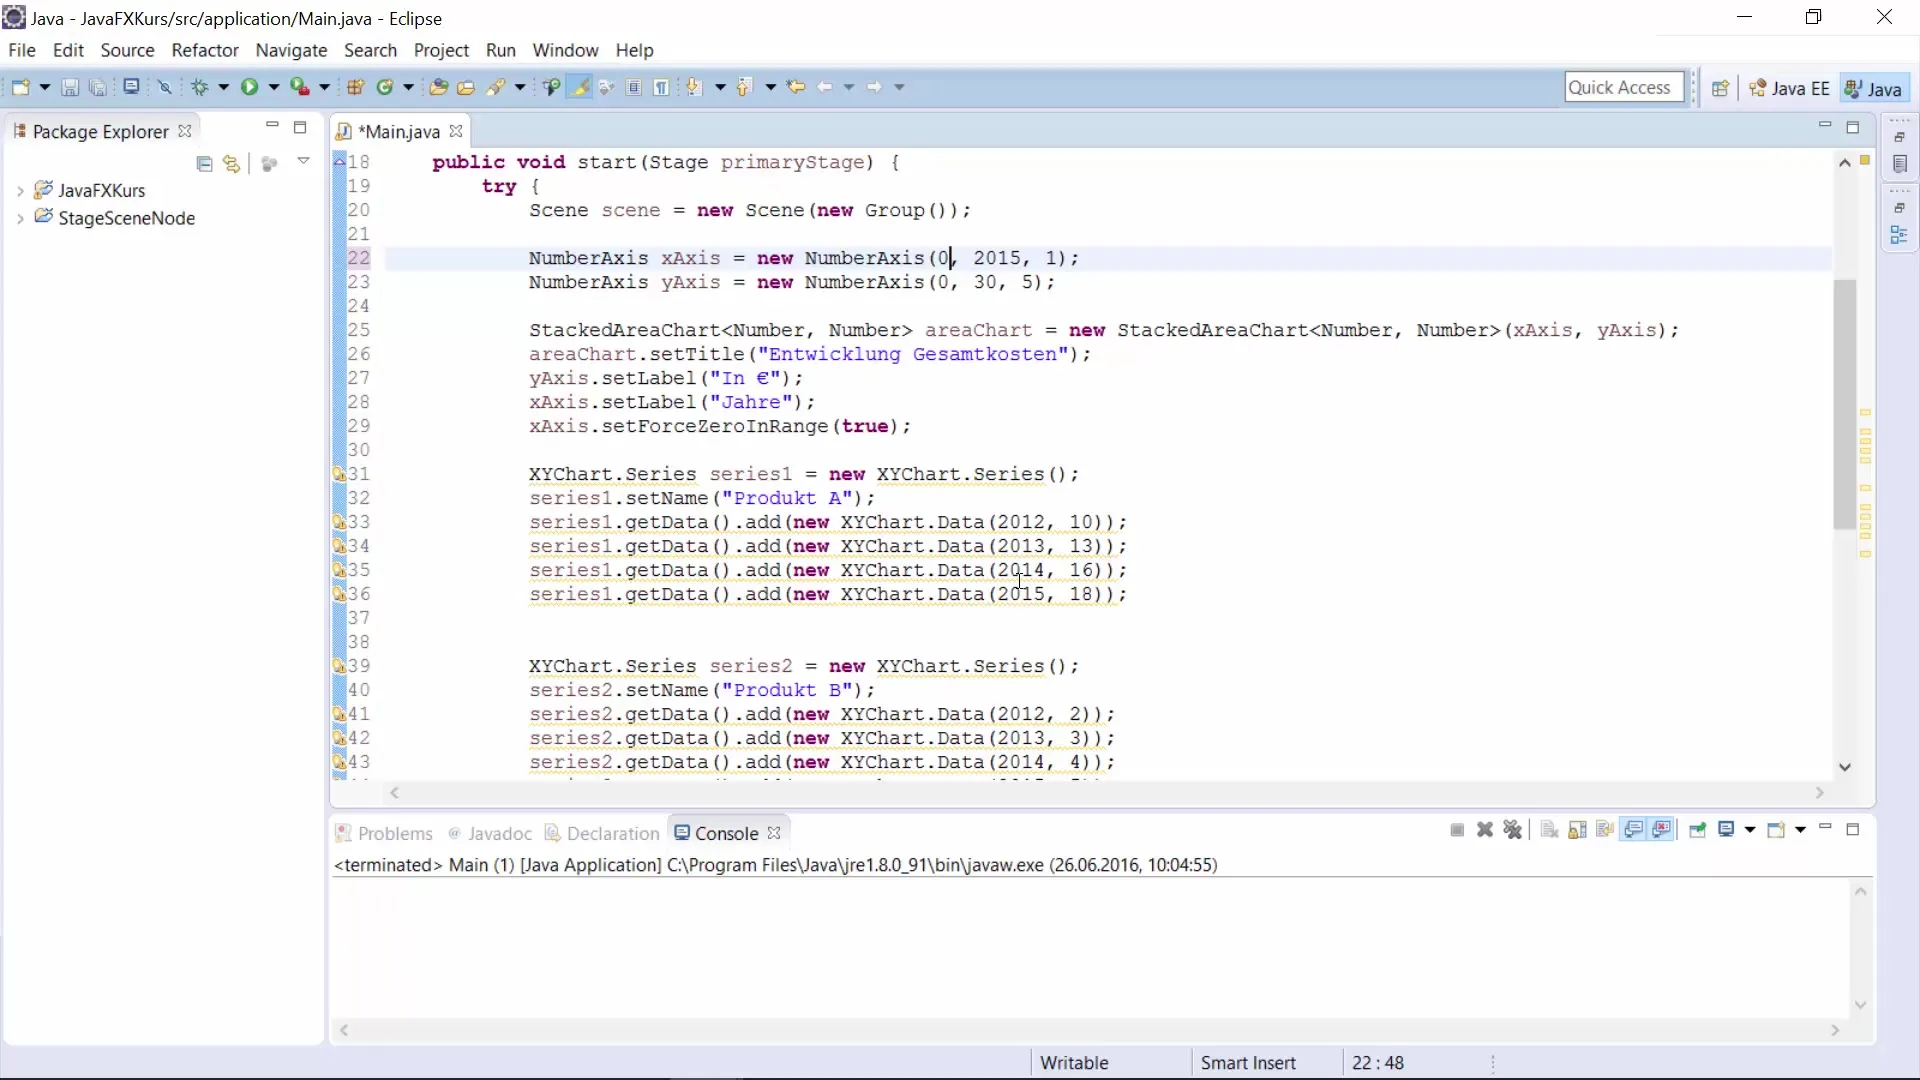
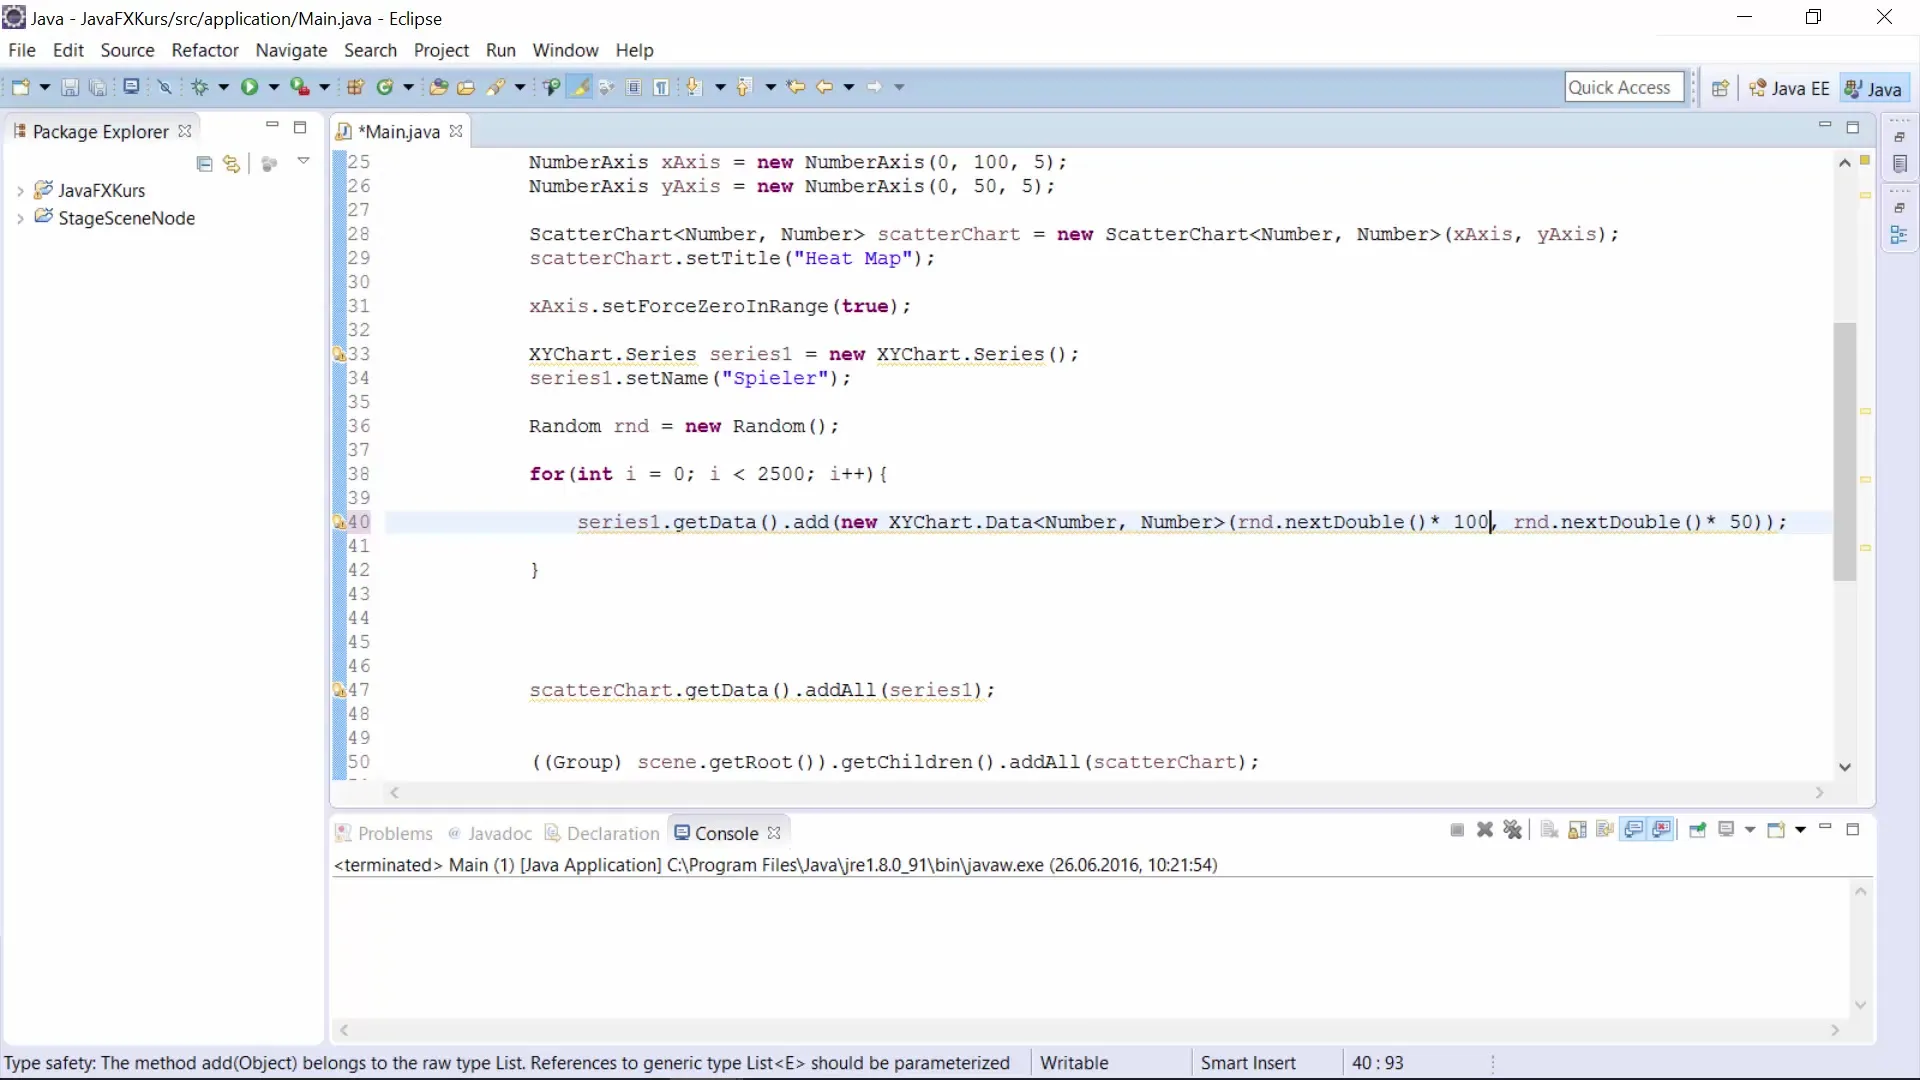
You need to define the axes for your scatter chart. In this case, you will use the X-axis from 0 to 100 and the Y-axis from 0 to 50. These settings are important to ensure you have a clear idea of which value range is relevant for your data.
3. Creating the Scatter Chart
Now it’s time to implement the scatter chart in your JavaFX project. Instead of using a stacked chart, you will create a scatter chart. For this, you need the appropriate class and must ensure that the chart is correctly placed within your user interface.
4. Adjusting the Data Source
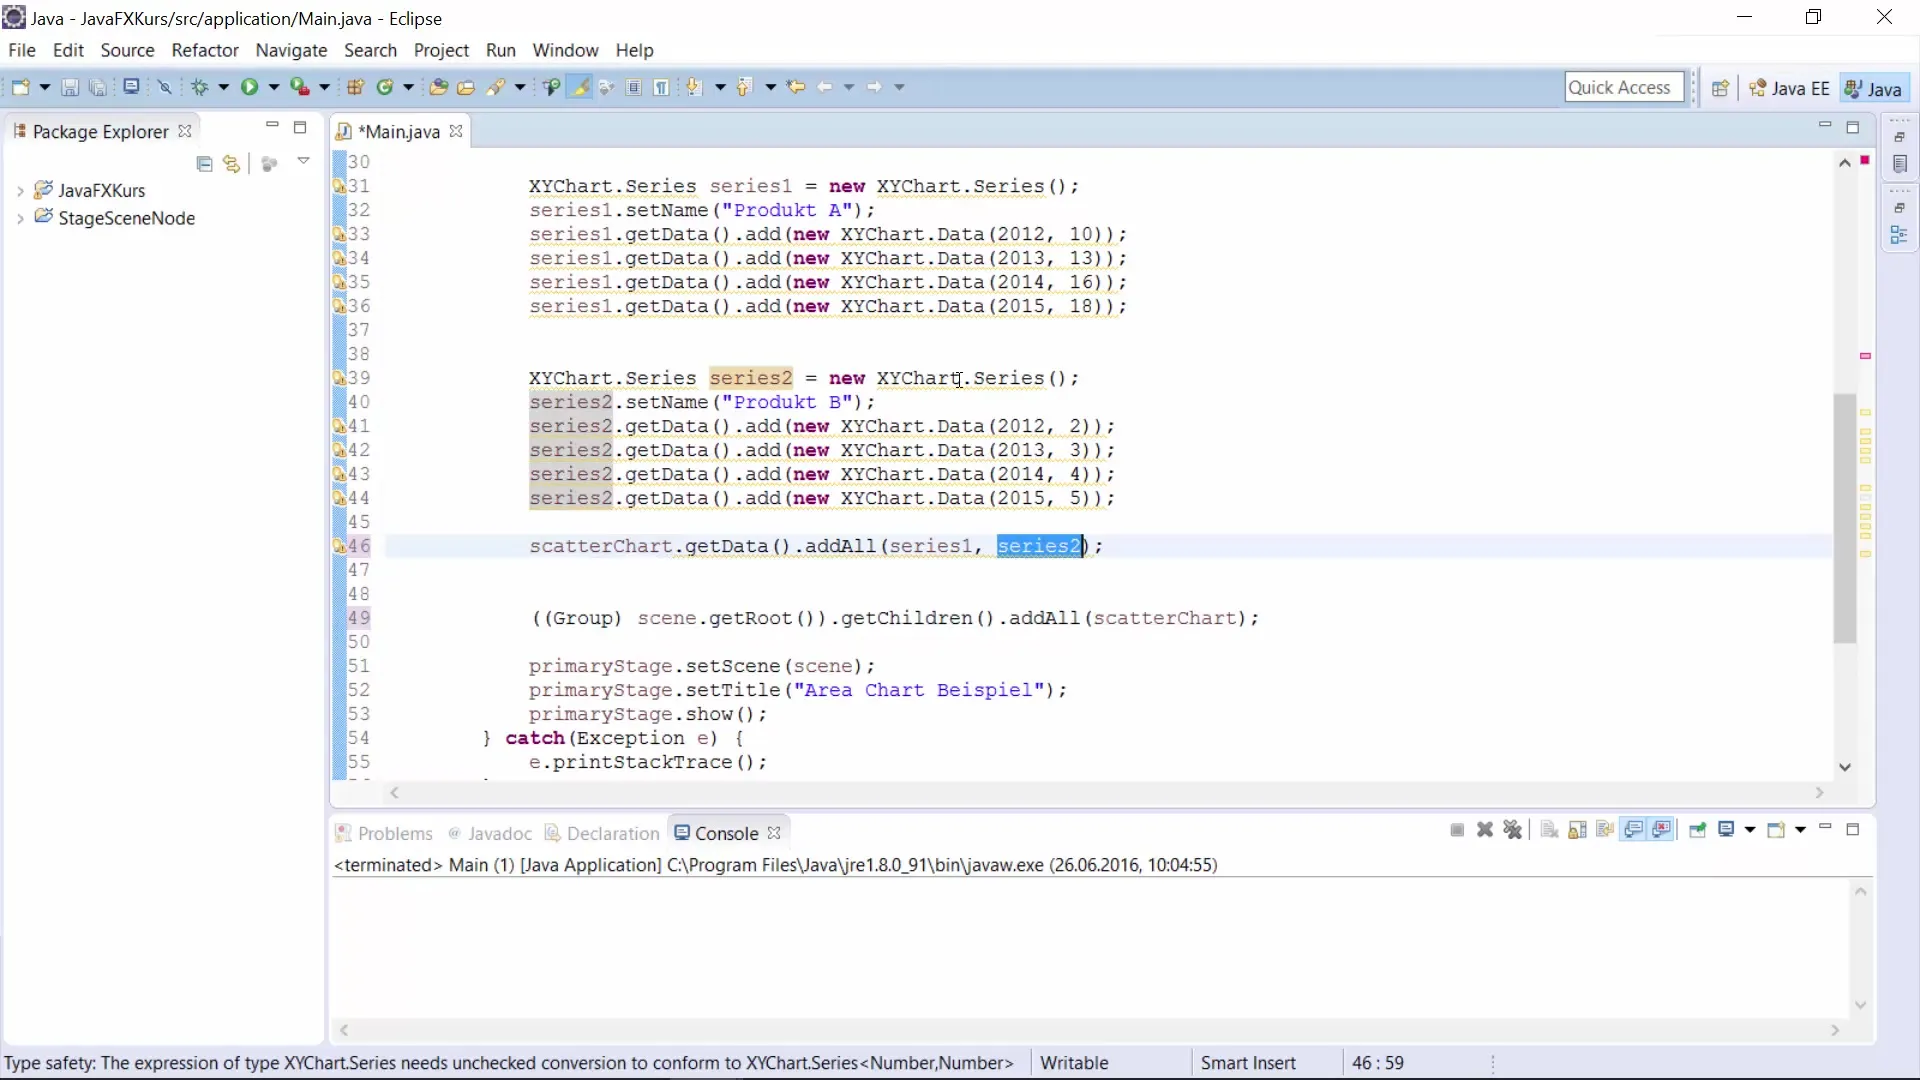
You will only use one data series, so you may delete the unnecessary second series. To avoid manually entering the points, you can generate random values. This is done by writing a loop that repeatedly calls a number generator and adds the values directly to your data series.
5. Generating Random Values
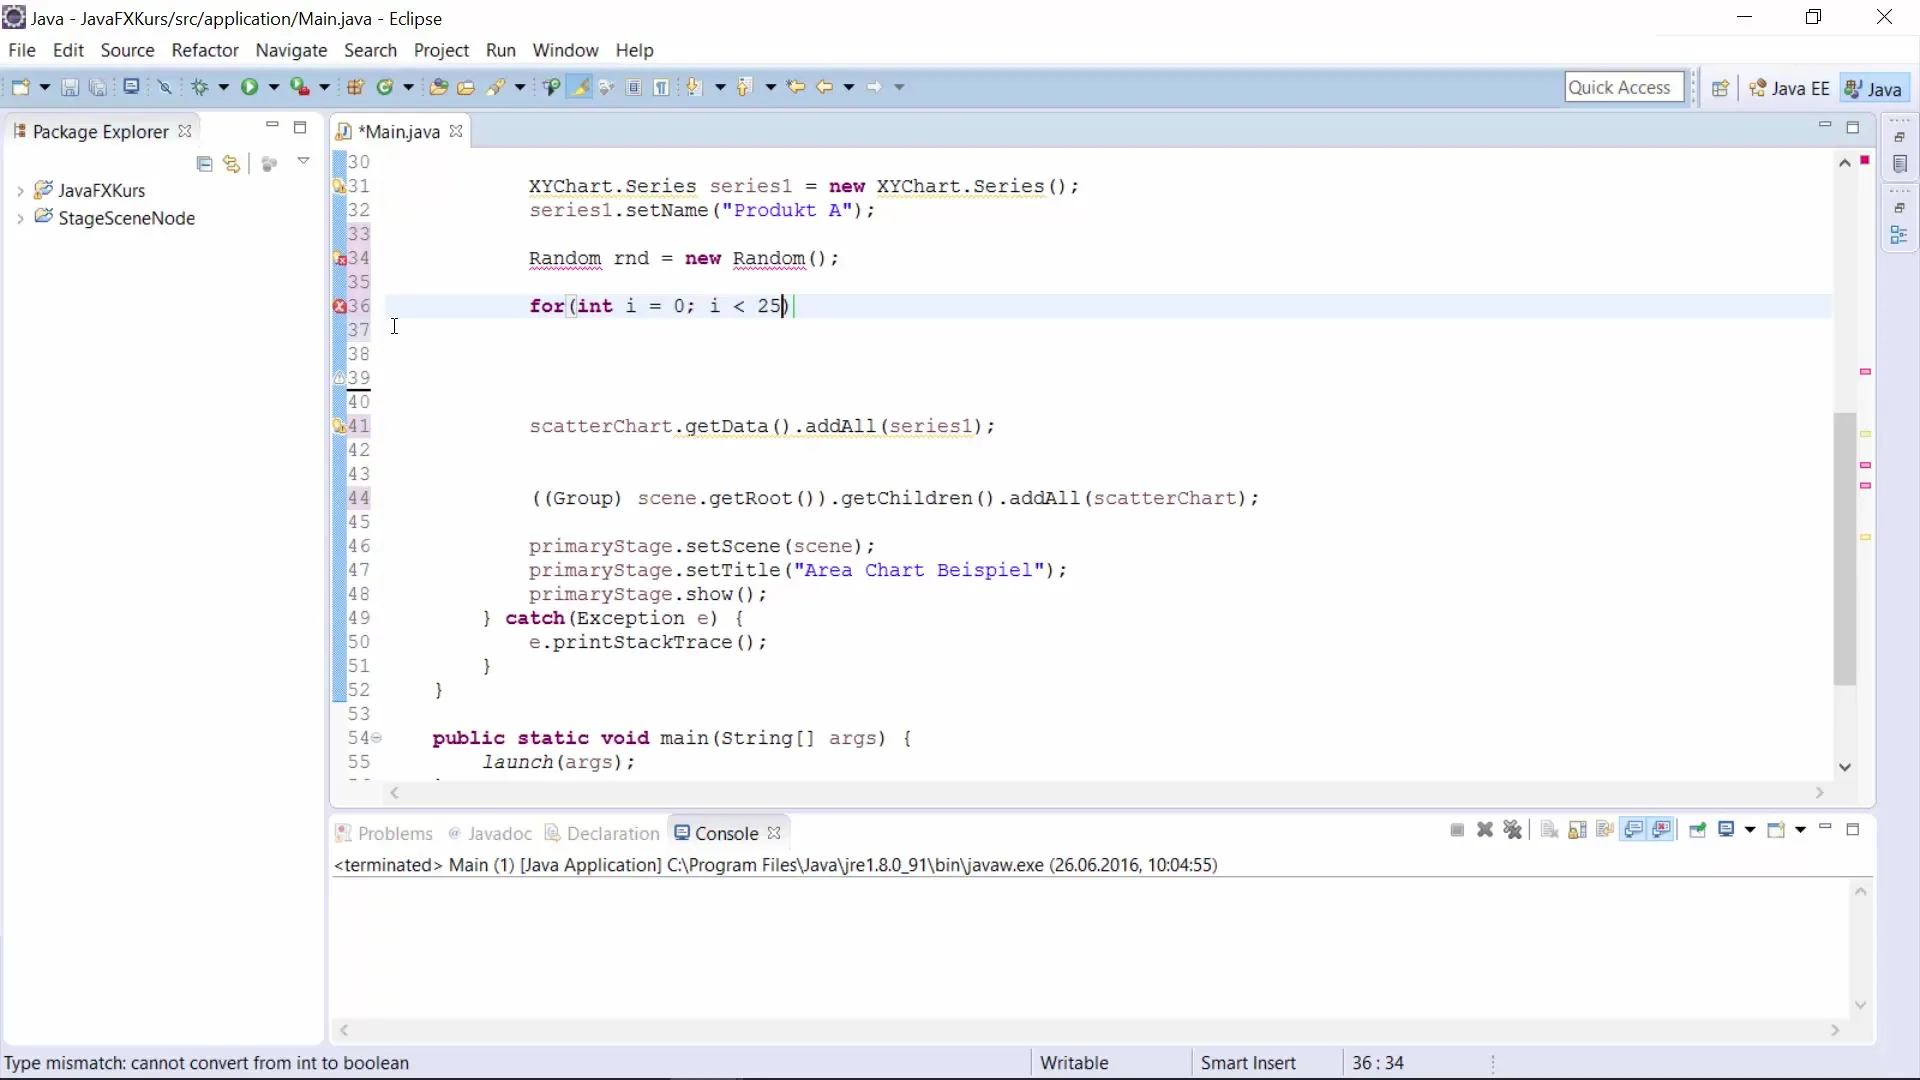
To generate 200 random values, you implement a loop that creates a random X and Y coordinate pair for each point. This is supported by functions like random.nextDouble(), which returns values within the defined bounds.
6. Mapping and Saving the Data
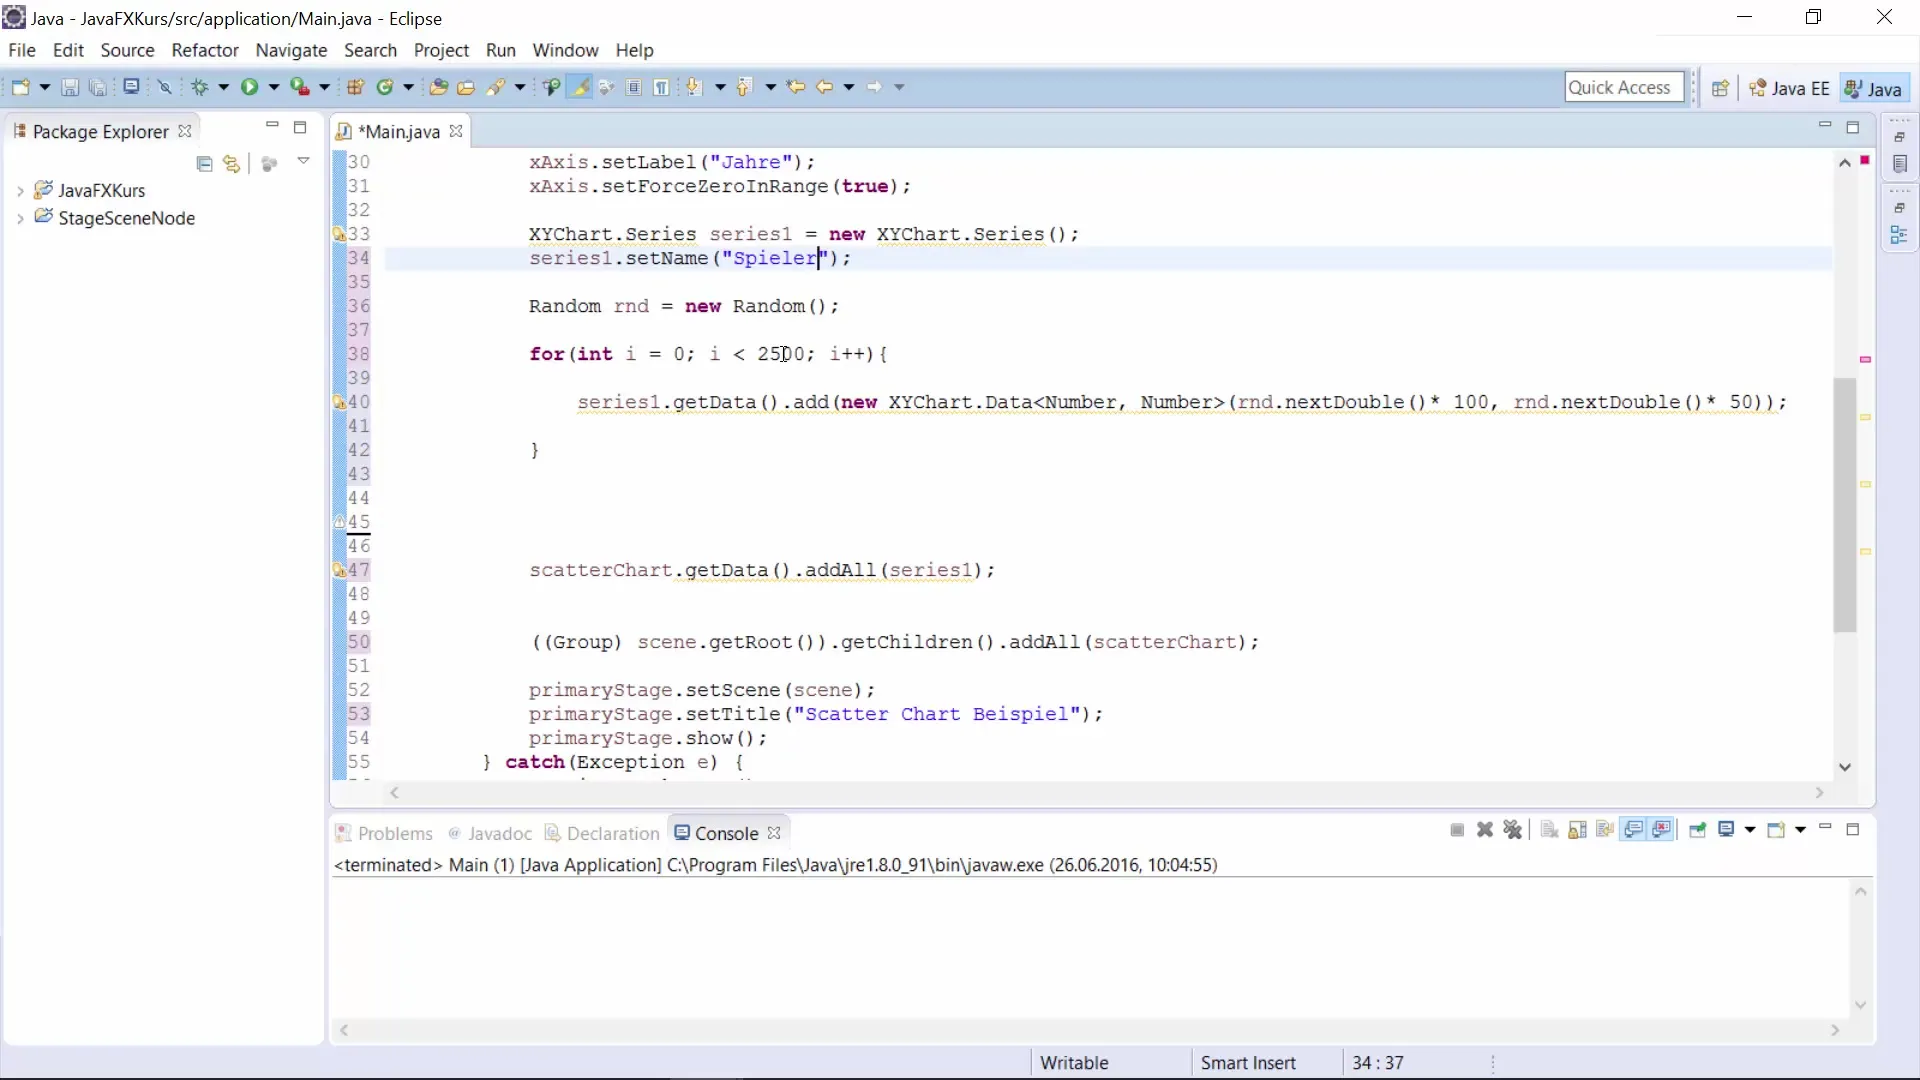
With the command series.getData().add(new XYChart.Data<>(xValue, yValue)), you add the generated points to the series. Now you have a dynamically generated point distribution for your scatter chart that already contains all relevant information.
7. Chart Title and Labels
Using appropriate titles and labels is crucial for the usability of your chart. Assign a meaningful title like “Heatmap” to your scatter chart to correctly identify the data presented.
8. Importing and Launching the Scatter Chart
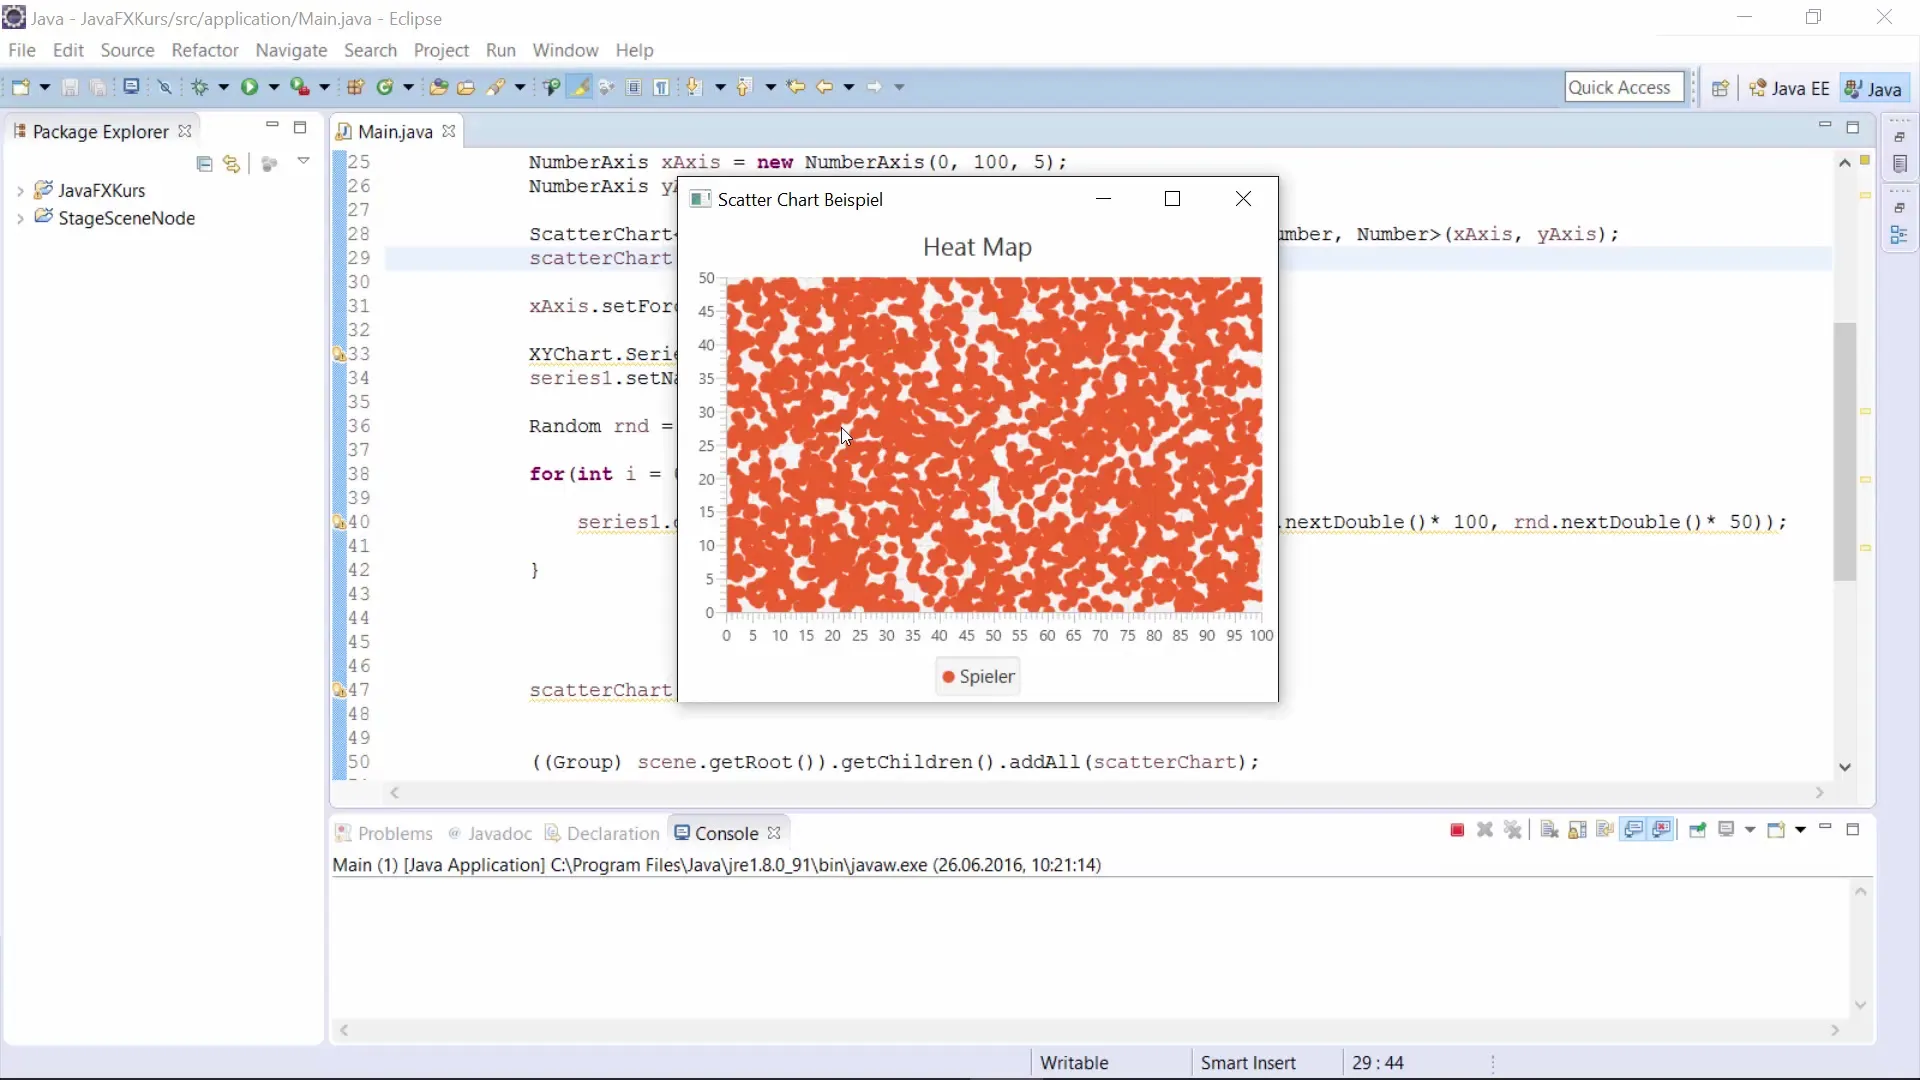
Make sure to import all the necessary packages to utilize the class for the scatter chart. Once everything is correctly imported and configured, you can launch the application and visualize the heatmap.
9. Analyzing the Point Distribution
Once your chart is loaded, you can analyze the point distribution. This type of representation can help you develop a better understanding of any patterns in game behavior, for example, on a soccer field.
10. Drawing Conclusions
The use of a scatter chart is particularly useful when you want to gain an overview of data distribution. You can adjust the visualization for different scenarios, whether for data analyses or for your business intelligence project.
Summary – Scatter Chart in JavaFX: A Step-by-Step Guide
With this guide, you have had the opportunity to create a scatter chart in JavaFX to efficiently visualize data points. The steps include setting the axes, creating a scatter chart, generating random values, and analyzing the resulting distribution.
Frequently Asked Questions
What is a scatter chart?A scatter chart displays data points as unconnected points on a coordinate system.
How do I generate random values for a scatter chart?You can use the random.nextDouble() method to obtain random values within a specified range.
How can I customize the representation of my data in the scatter chart?You can adjust the axes, titles, and data points according to the requirements of your analysis.


