If you are interested in displaying data, a bar chart is one of the most effective ways to present information visually. In this guide, you will learn how to create a bar chart (BarChart) using JavaFX. By using bar charts, you can easily identify significant trends and comparisons. Let's dive in!
Key Insights
To create a bar chart in JavaFX, you need the basic classes for the chart, including CategoryAxis for the X-axis and NumberAxis for the Y-axis. You can add different series of data and set labels for the axes to improve the readability of your chart.
Step-by-Step Guide
Creating a bar chart in JavaFX is a straightforward process that you can go through in several steps.
Step 1: Basics of the Bar Chart
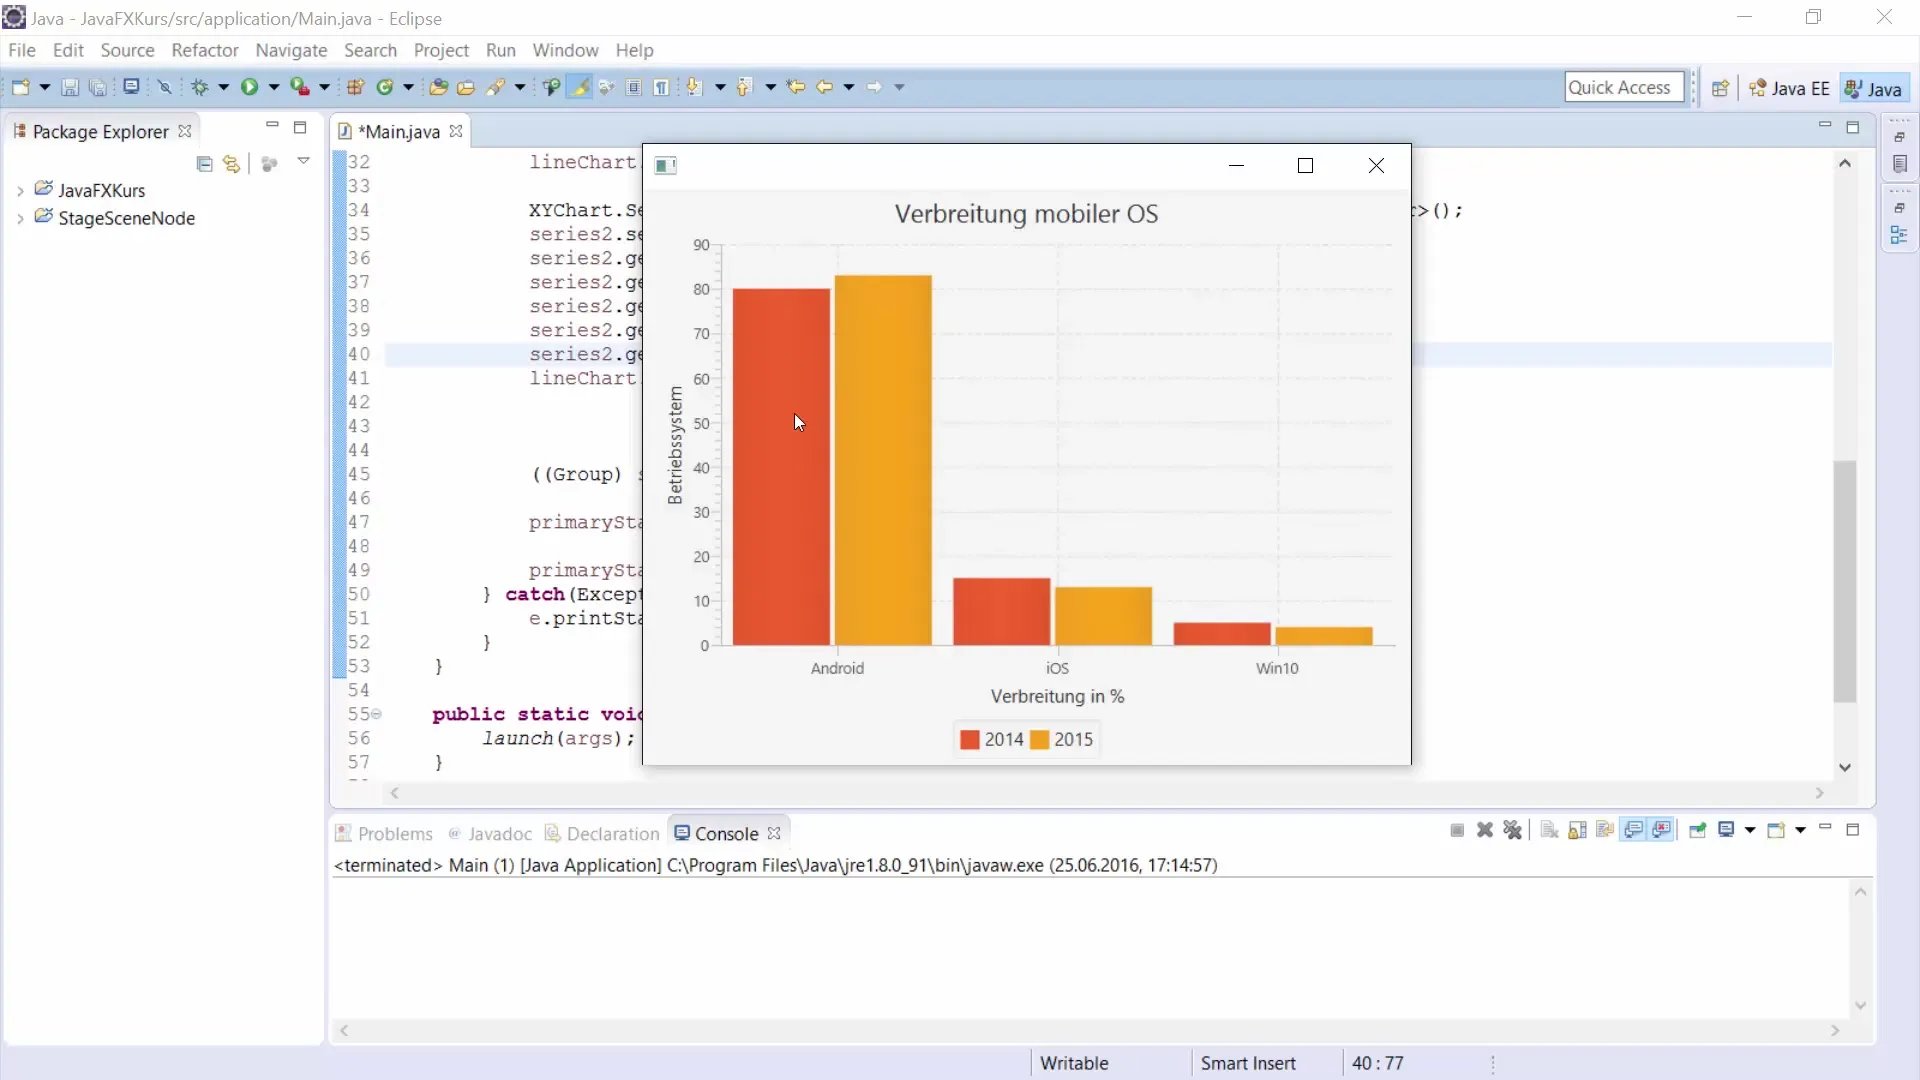
Before we start with the implementation, take a look at an example of a bar chart. Here we present the distribution of various mobile operating systems over the years. You have already seen the basic elements of the chart, such as the bars representing each operating system.
Step 2: Defining the Data
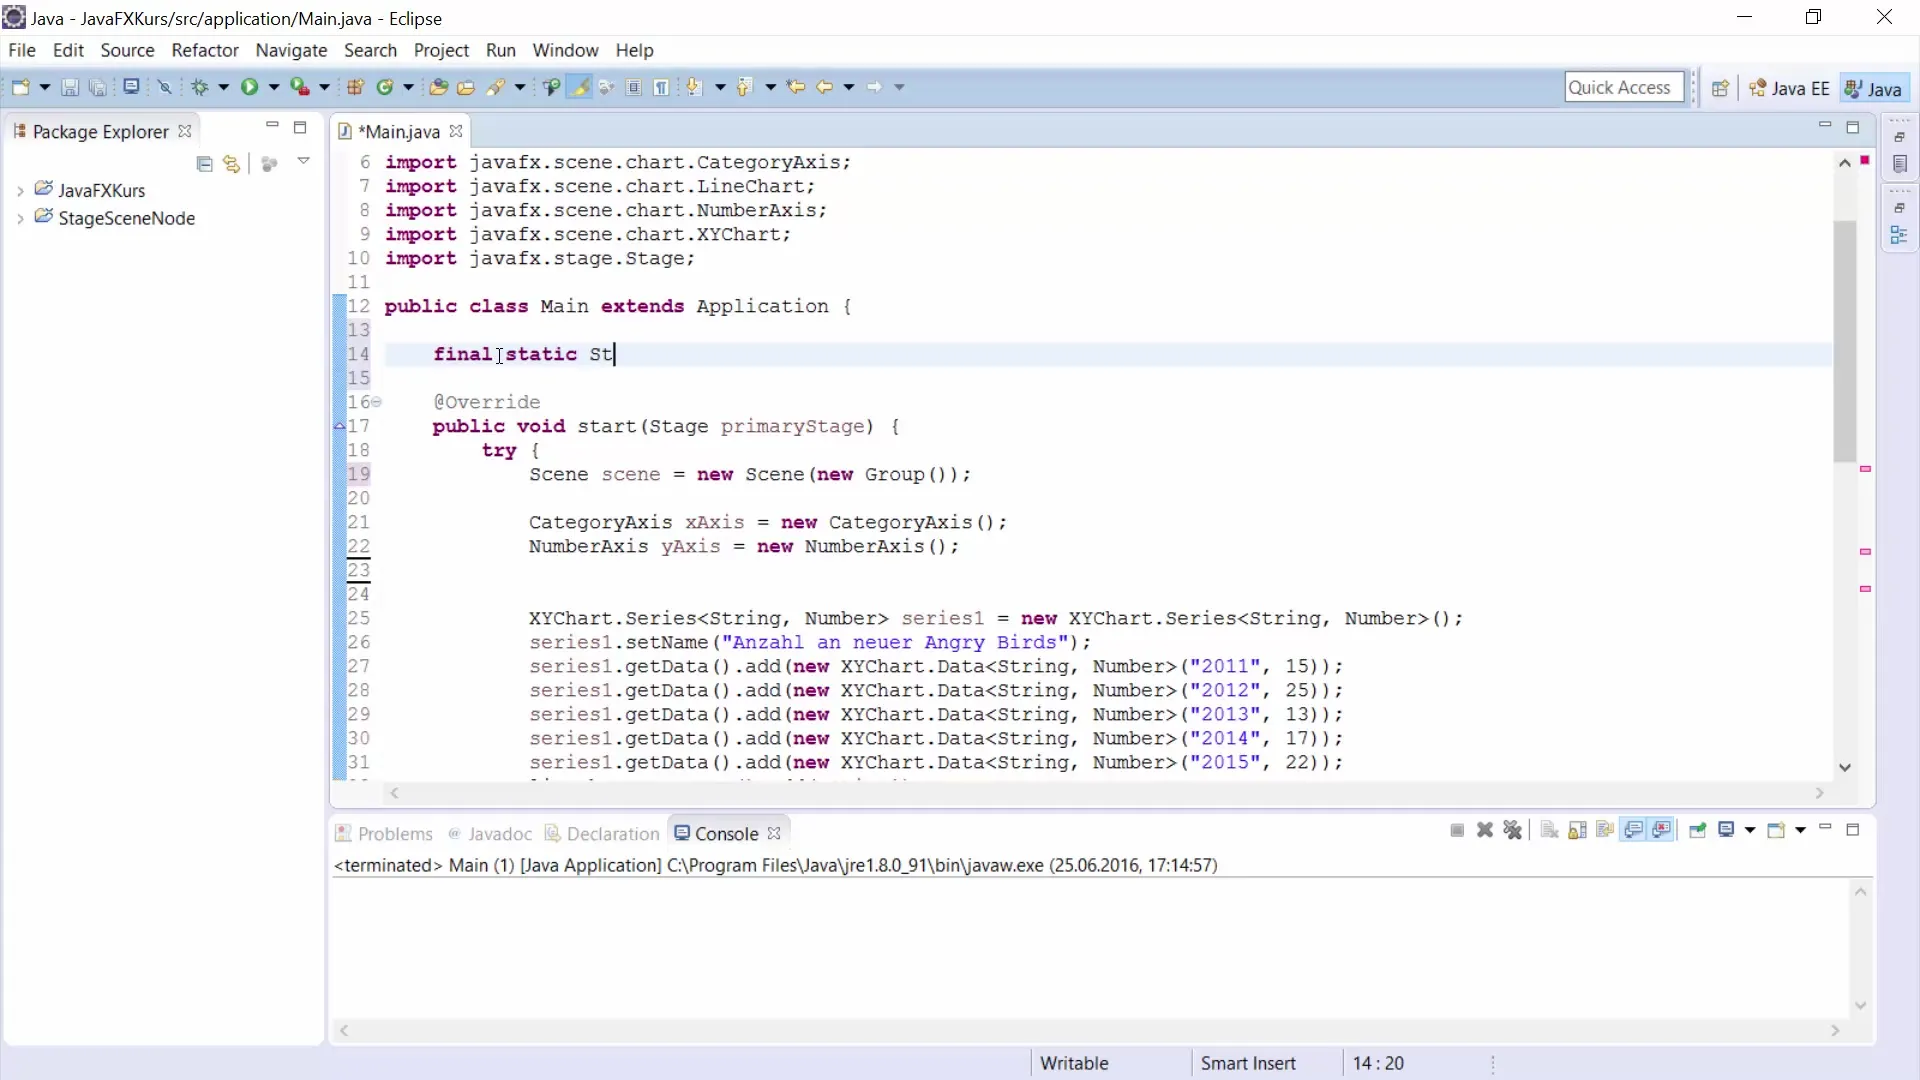
First, you need to define some strings that represent the operating systems. Copy the specifications for the different operating systems you want to display in the chart. For example:
Now you have all the necessary data for the X-axis representing the operating systems.
Step 3: Creating the Axes
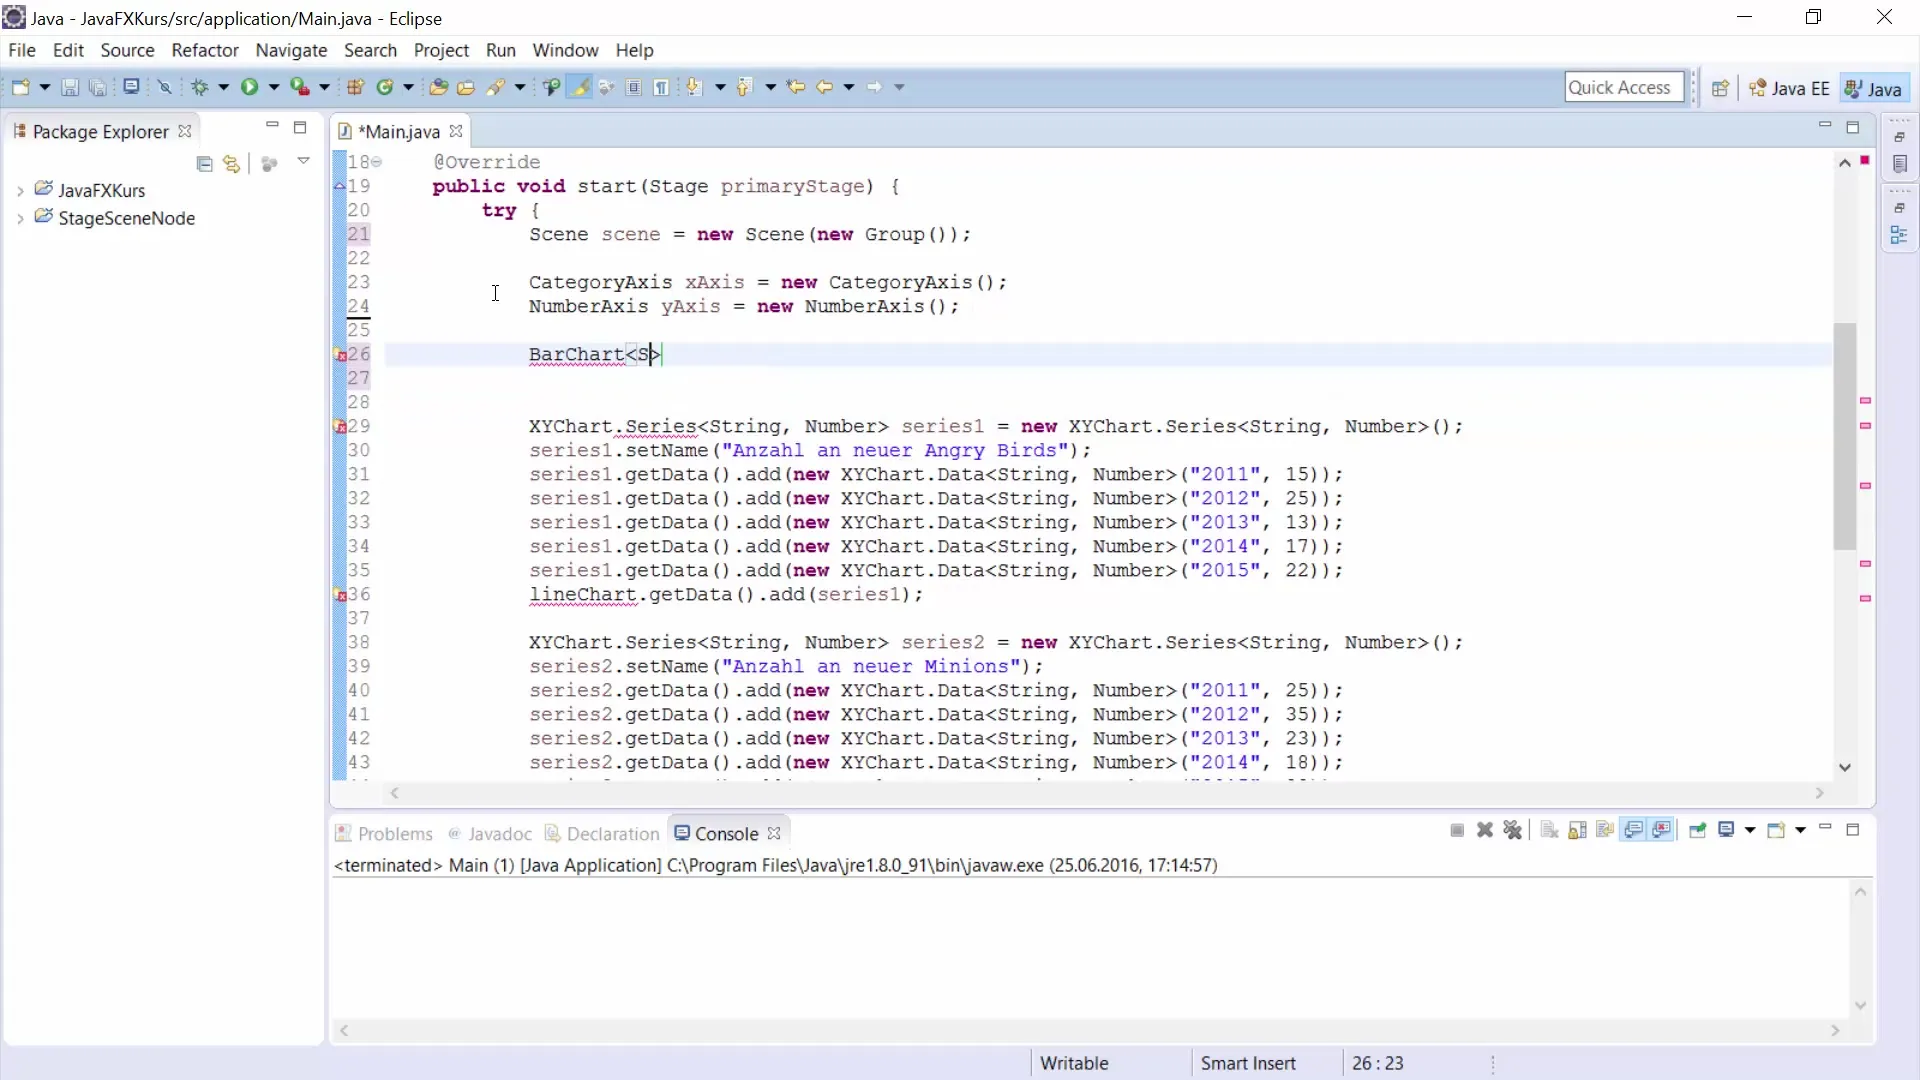
To create the bar chart, you need both a category axis (for the operating systems) and a numerical axis (for the distribution in percentages). Create the axes as follows:
Step 4: Initializing the Bar Chart
By setting a title, your bar chart will gain more context.
Step 5: Labels for the Axes
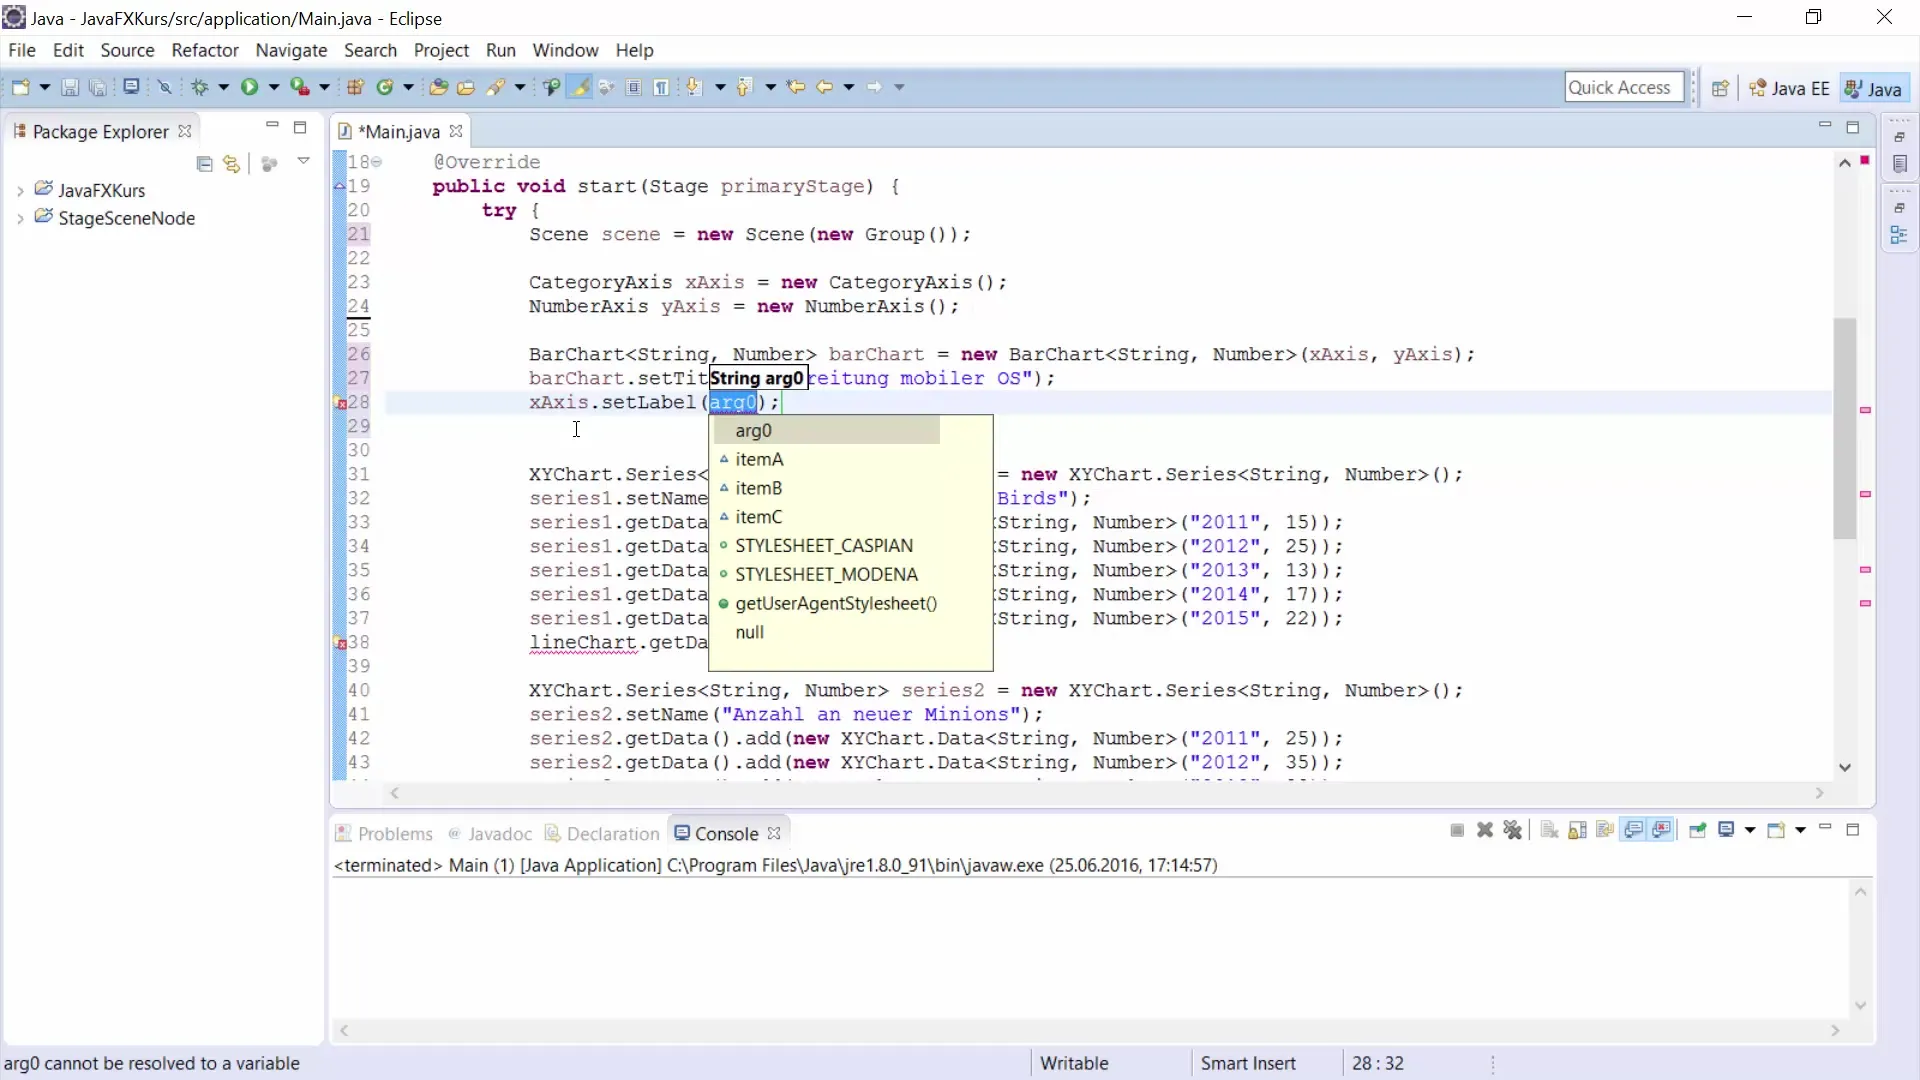
To make your chart clearer, you should add labels for the axes. This helps viewers better interpret the displayed data:
Step 6: Adding Data Series
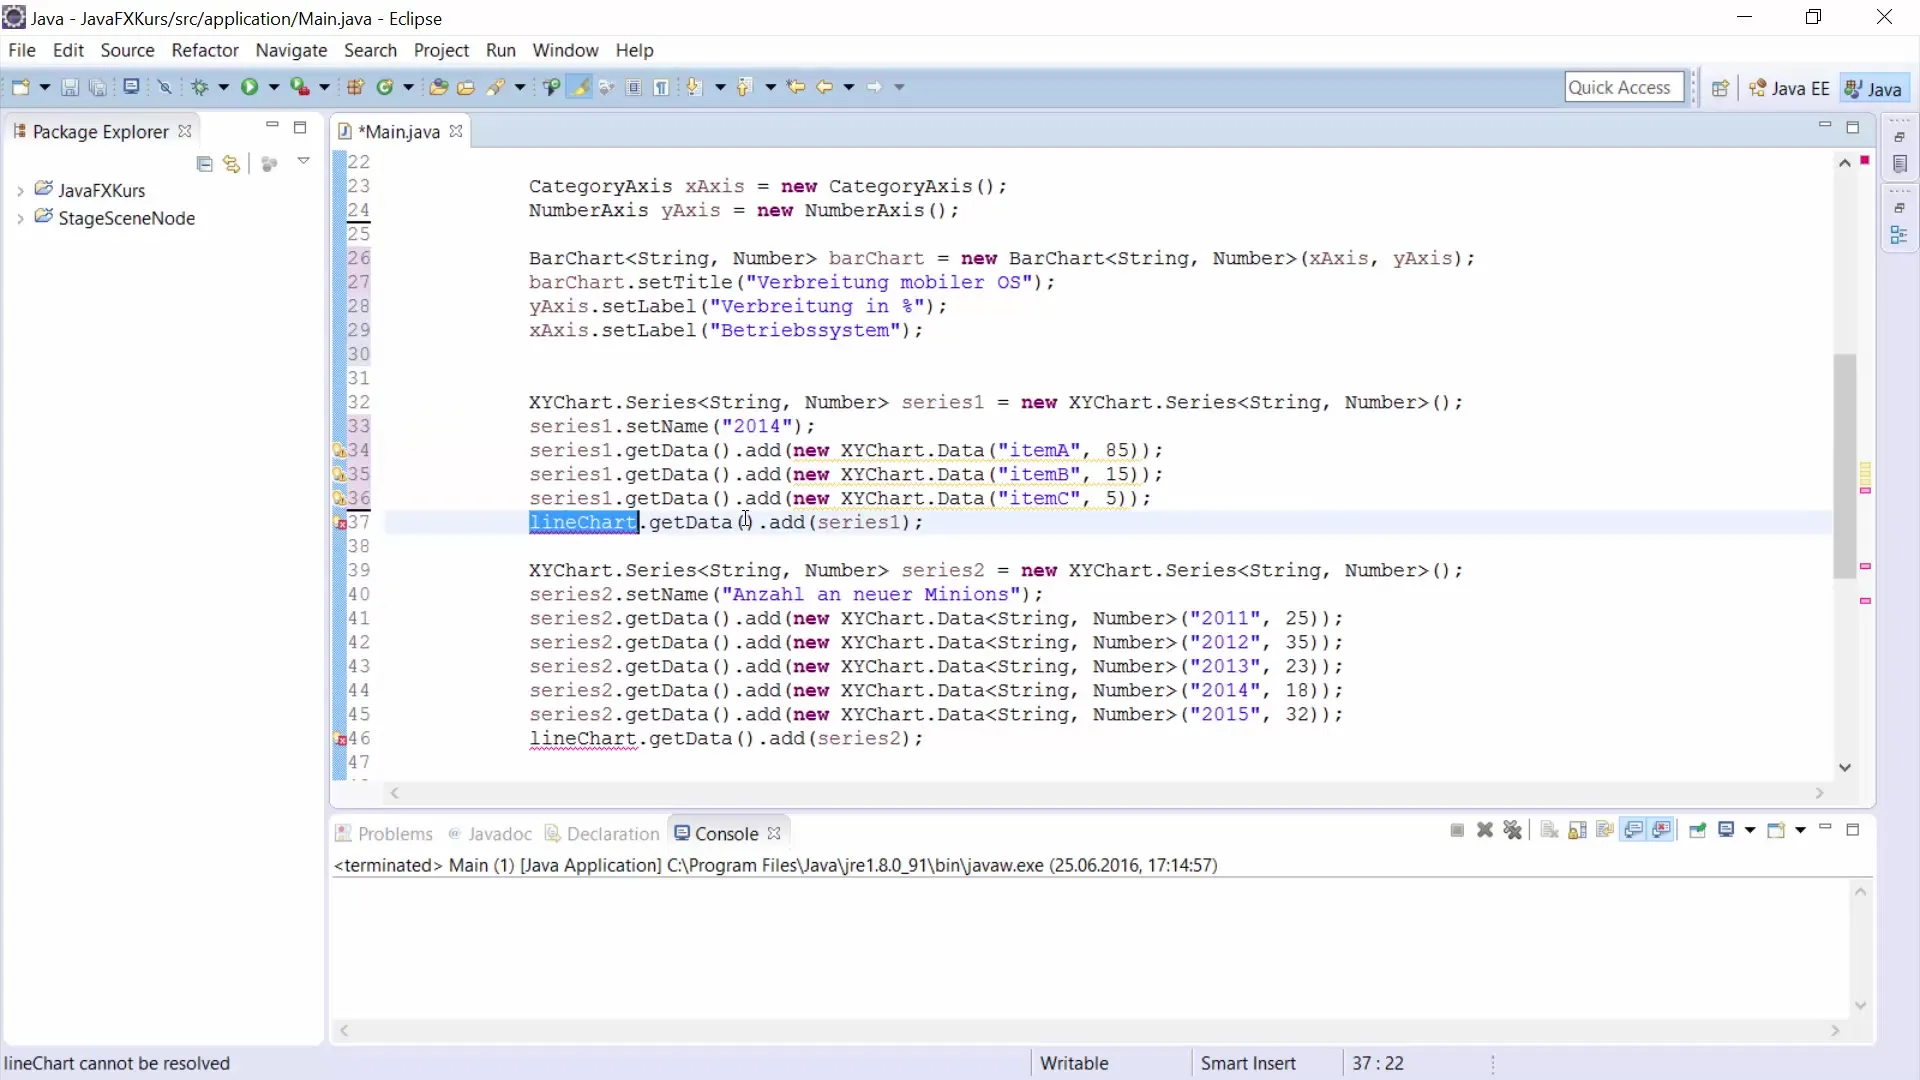
Now it's time to add the data in the form of series. Create the first data series for the year 2014:
Here you have set the distribution data for each operating system in 2014.
Step 7: Adding a Second Data Series
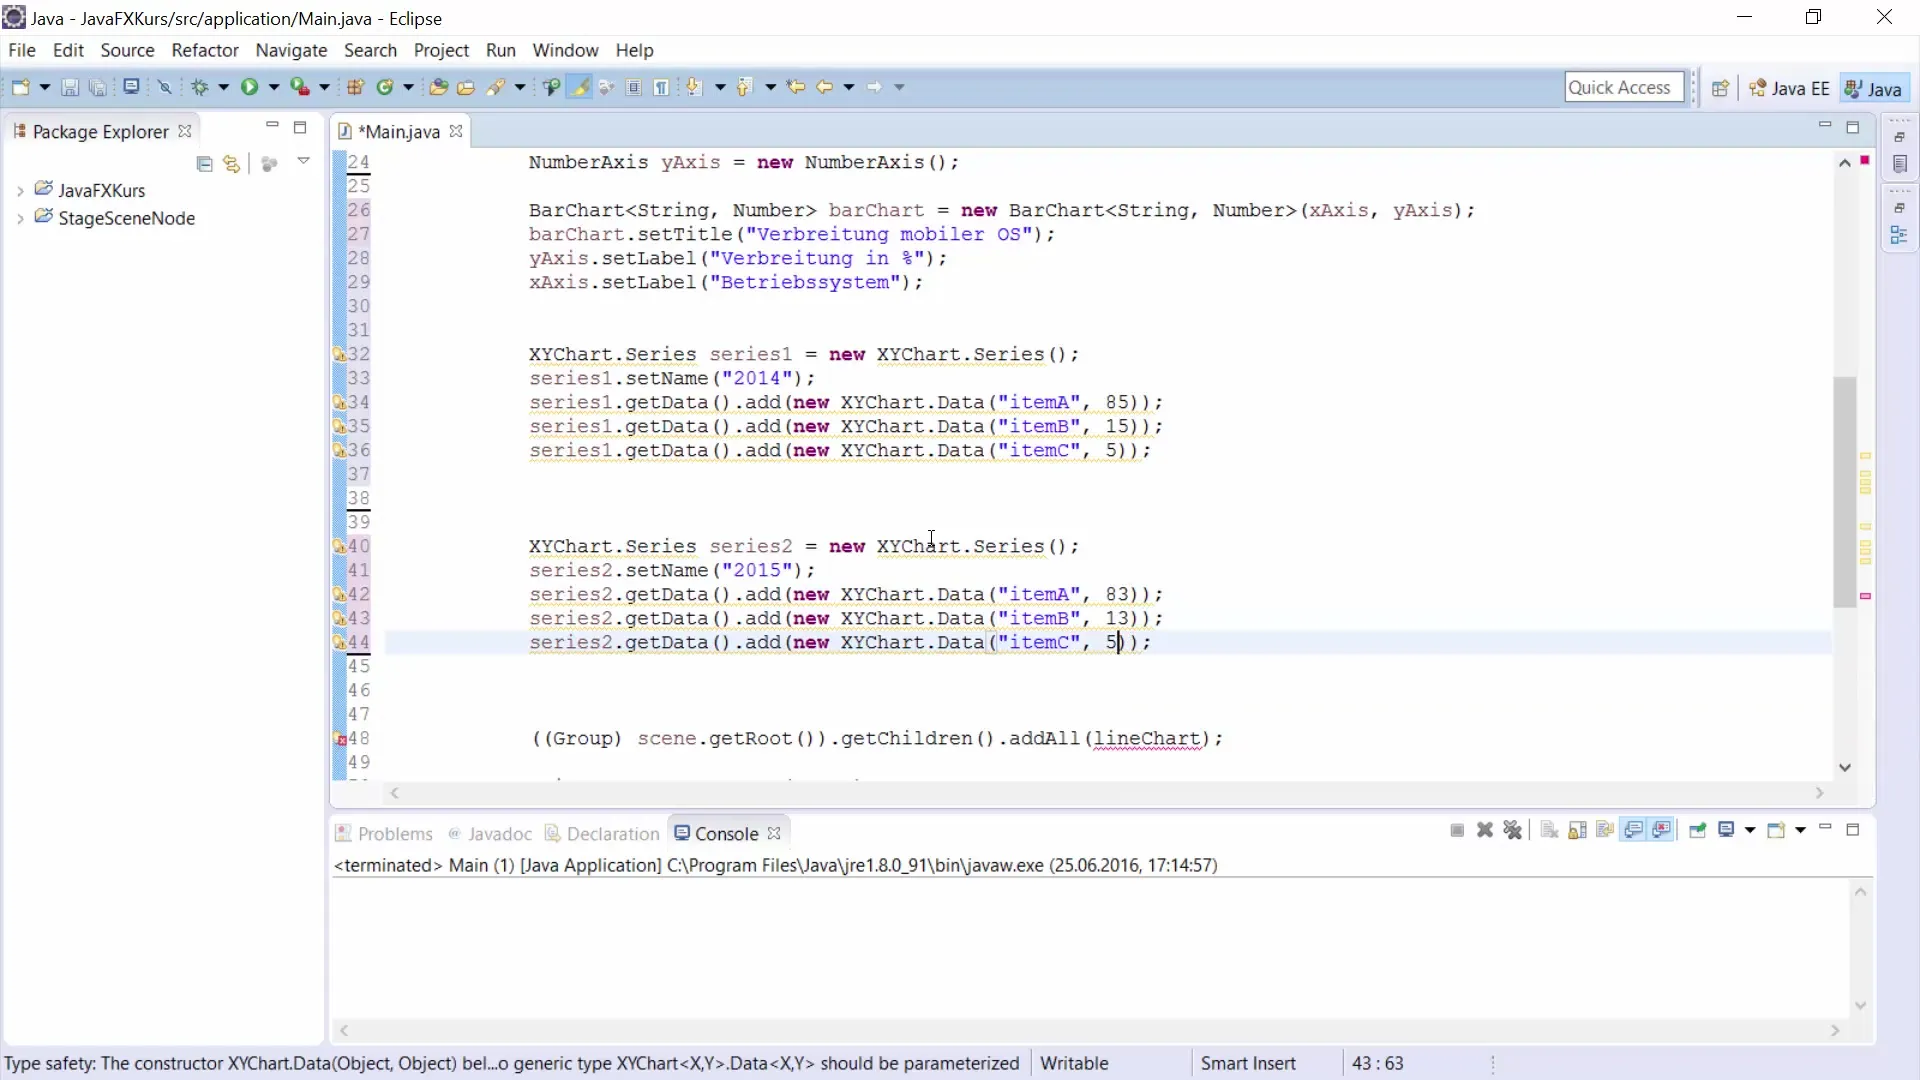
You can add a second data series for the year 2015. This allows you to represent changes over time. Create this series similarly to the first:
Step 8: Adding Data to the BarChart
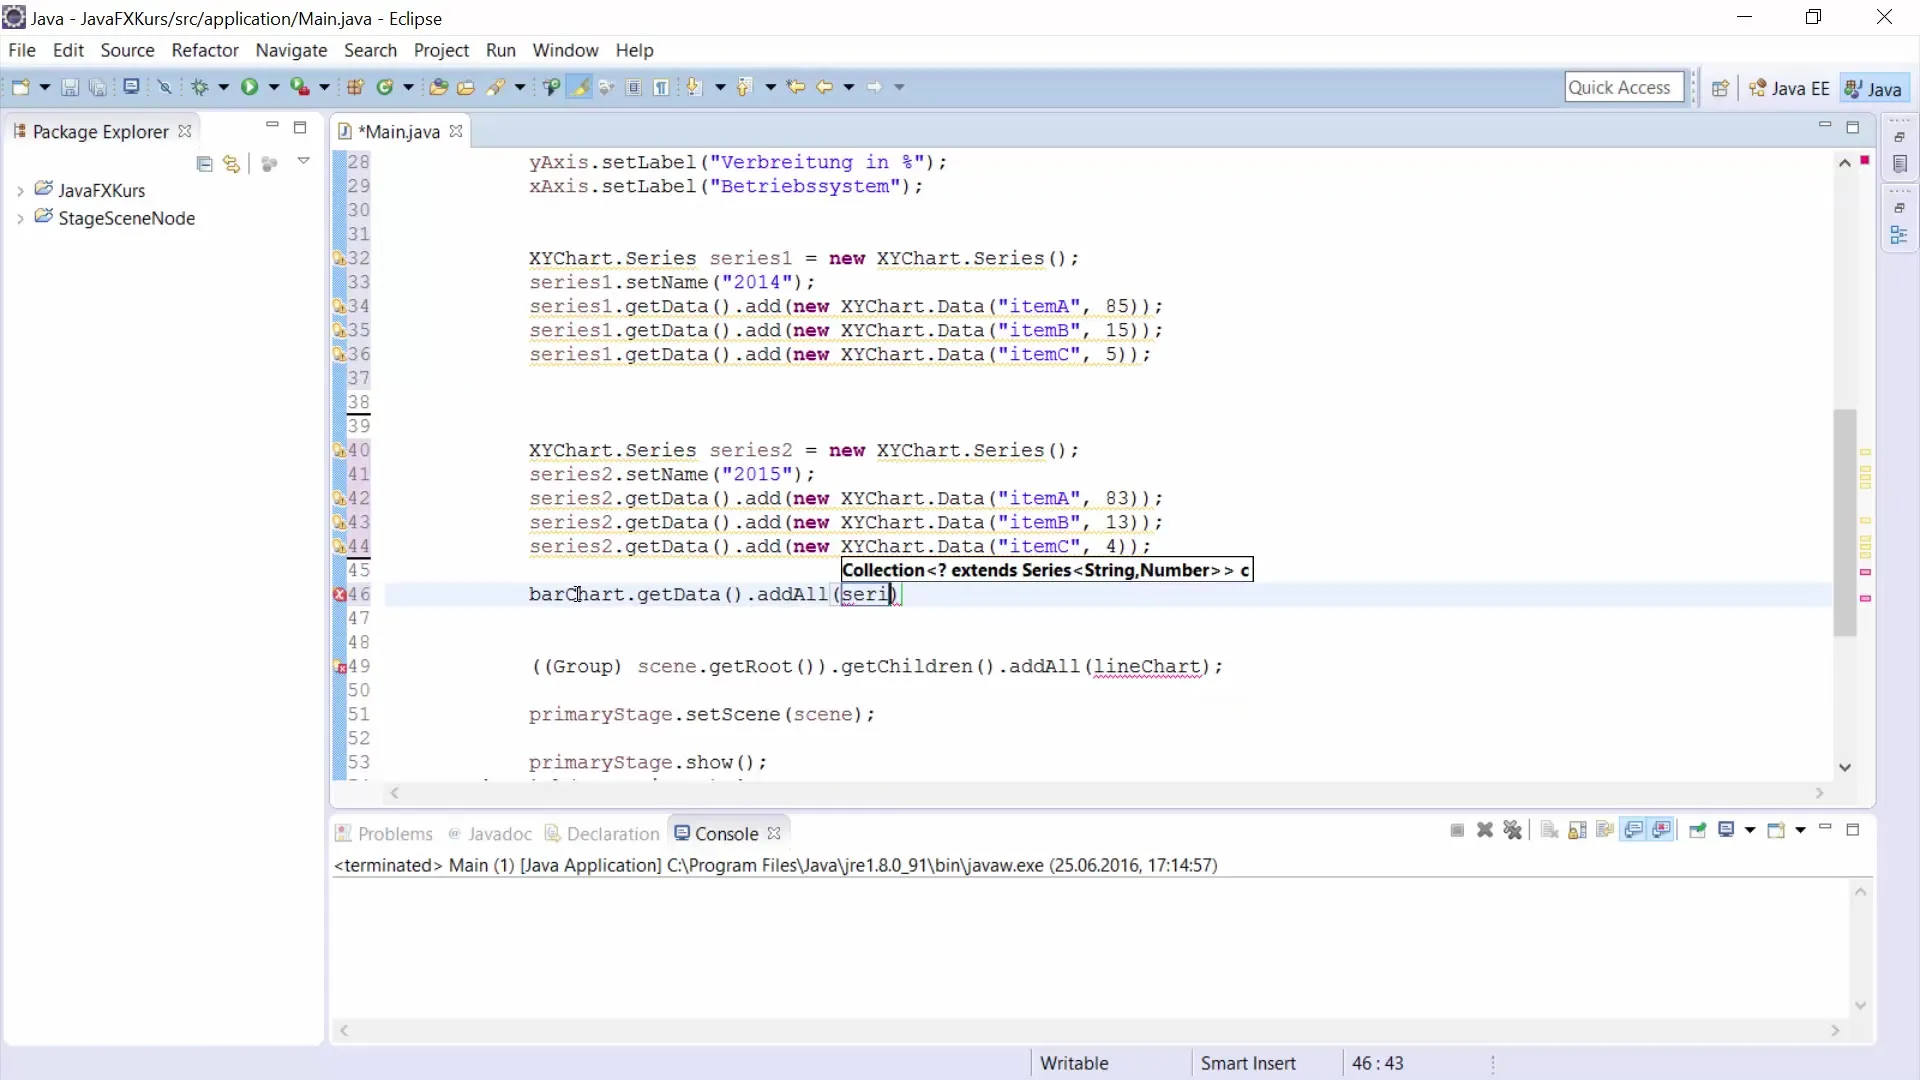
To complete your bar chart, you need to add the series to the BarChart:
Now you have added both data series. The chart is ready to be rendered.
Step 9: Displaying the Bar Chart
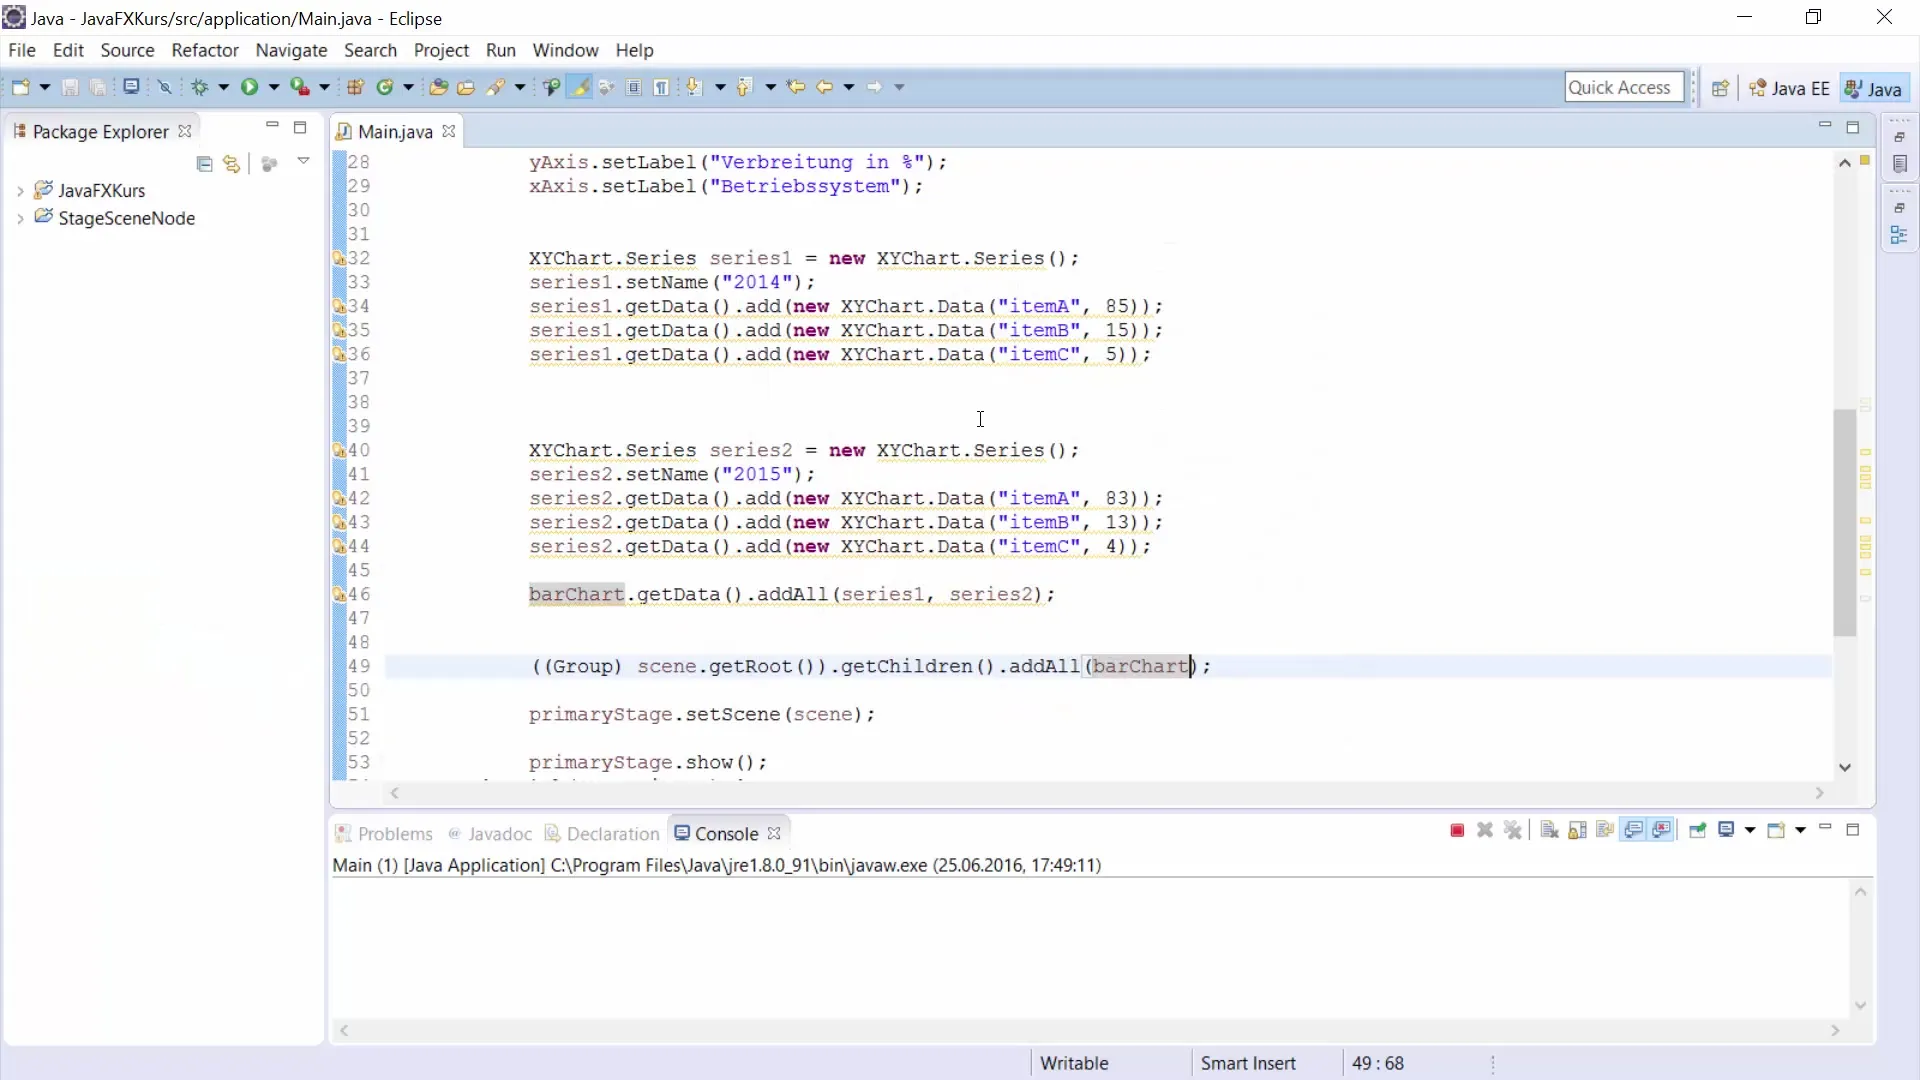
Now you can display the chart. Use an appropriate scene and stage to make your chart visible on the screen. You have completed all the steps to create your bar chart.
Summary
In this guide, you have learned how to create a bar chart using JavaFX. You have gone through the basic steps from defining the data, creating axes, and adding data series to displaying the chart. You have also seen how static strings and axis configurations help optimize presentation. With these techniques, you can present data visually appealingly and informatively.
Frequently Asked Questions
How do I create a BarChart with JavaFX?Create a new BarChart with CategoryAxis for the X-axis and NumberAxis for the Y-axis, and then add the data series.
Can I display multiple data series in a BarChart?Yes, you can add multiple series to your BarChart to represent different points in time or categories.
How do I set titles and labels for a BarChart?Use the setTitle() method for the chart title and the setLabel() method for the axis labels.
How can I customize the appearance of a BarChart?You can customize colors, widths, and styles using CSS styles or JavaFX attributes.


