
If you have already worked with Levels, you already know the basic principle: You control the contrast of an image via brightness values. Curves go one step further. Instead of only setting the black point and white point, you place as many anchor points as you like on a curve and thereby determine precisely which tonal values are changed and by how much. In addition, this adjustment layer lets you selectively shift the colors of individual tonal ranges. In this guide, I walk you through all the important functions step by step, using the same image that was used in the Levels tutorial.
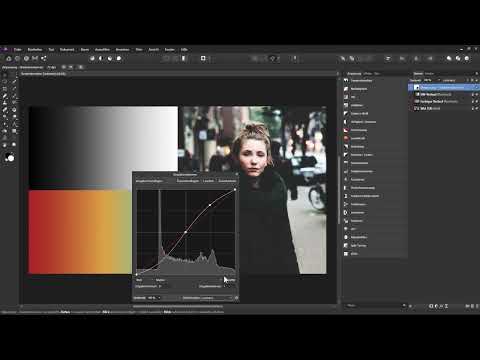
The video is only loaded from YouTube when you play it – data (including your IP address) is then transmitted to YouTube/Google. More in the privacy policy
Key Takeaways
- Curves control brightness via freely placeable anchor points and are therefore more precise than Levels.
- An anchor point on the diagonal brightens when dragged upward and darkens when dragged downward.
- An S-curve increases contrast if you fix the anchor point in the midtones before shaping the curve.
- With the "Luminosity" blend mode, the adjustment affects only brightness, while color saturation remains untouched.
- With the eyedropper, you set anchor points directly in the image by clicking and dragging at the desired spot.
- In RGB mode, you can edit individual color channels. The opposing colors red–cyan, green–magenta, and blue–yellow help you predict the effect.
Step-by-Step Guide
Creating Curves as an Adjustment Layer
Getting started works like with any other adjustment layer. Click the adjustment layer button at the bottom of the Layers panel and then select "Curves". Since no layer was selected in my example, the new adjustment layer ends up at the very top of the Layers panel. Make sure it is in the right place, because it affects all layers beneath it.

After creating it, the Curves dialog opens. Here too, you can see the current histogram in the background, that is, the distribution of tonal values in the image. This helps you assess, even before the first correction, whether the image is lacking highlights, shadows, or midtones.
Understanding the Structure of the Curve
The diagonal between the two endpoints is your starting point. The lower left anchor point determines the black point, the upper right one the white point. Unlike with Levels, they are offset diagonally, and this is exactly what the entire tool is built on. Every point on this line corresponds to a tonal value: the shadows are on the left, the midtones in the middle, and the highlights on the right.
Setting the Black and White Points
Before you work with additional anchor points, it is worth taking a look at the endpoints. If you drag the lower left anchor point to the right, all tonal values to the left of it become pure black. The curve shows this with a horizontal line at the bottom edge. If, on the other hand, you drag the upper right anchor point to the left, the bright tonal values become pure white. In this way, you increase contrast by pulling the tonal values at the ends of the scale further outward, so to speak.


Setting Anchor Points for the Midtones
To edit the midtones selectively, simply click on the diagonal at the desired spot. A new anchor point is created there. If you drag it upward, the midtones are brightened. If you drag it downward, they are darkened. The direction is easy to remember: upward gets brighter, downward gets darker.
Using the Course of the Curve
Unlike with Levels, an anchor point does not affect just one single tonal value. The change is distributed across the neighboring tonal values according to the course of the curve. As a result, corrections look more natural because no harsh transitions arise. In this way, you can fine-tune the contrast very precisely by shaping the curve bit by bit.

Creating an S-Curve for More Contrast
An S-curve is one of the most common techniques for increasing the contrast of an image. To do this, you first place an anchor point in the middle and, if necessary, push it back to its original position. Then you place one more point each in the lower and upper areas of the curve. If you drag the upper point upward, the lighter tones are brightened. If you drag the lower point downward, the darker tones are darkened. Since you fixed the center point beforehand, the midtones remain largely unchanged.

Protecting Colors with the Luminosity Blend Mode
Increasing contrast often also boosts color saturation, which is not always desirable. To change only the brightness, switch the blend mode of the adjustment layer to "Luminosity". After that, your curve affects only the brightness contrast, and the colors in the image are preserved. You already know this blend mode from the tutorial on levels adjustment.

Removing Anchor Points Again
If you don't like an adjustment, you can remove anchor points at any time. To do so, right-click the point in question and select the option to delete it. So you don't have to discard the entire layer, but can selectively backtrack.
Working Directly in the Image with the Eyedropper
If placing anchor points on the diagonal feels too abstract, use the eyedropper. Activate the button in the dialog box, and your mouse pointer turns into a crosshair. If you now click on an area of the image and drag the mouse downward, exactly the tonal value under the cursor is darkened. If you drag upward, it is brightened. This way you can edit several areas one after another without manually placing a single point on the line. This is especially intuitive if you want to work on the image itself like a photographer.

Selecting the Color Channels
Curves are also excellent for changing the color look of an image. At the bottom of the dialog box you will find a menu where you select the individual channels. With an RGB color format, the red channel, the green channel, and the blue channel are available separately from one another. If you select the red channel, for example, the diagonal appears in red, and your changes affect only this color component.

Adding and Removing Red
If you set a midpoint in the red channel and drag it upward, red is added to the image, mainly in the midtones, and somewhat less in the highlights and shadows. If you drag the point downward instead, you remove red from the image. But what color results then? The color model provides the answer: in the red channel, removing red produces the opposite color, cyan.

Checking the Color Format in the Document
Before you memorize opposite colors, you should know which color model you are working with. You can find this setting under "Document" and "Color Format". In this example, RGB is active. There is also the CMYK format, which is mainly used for print documents. The letters stand for Cyan, Magenta, Yellow, and Black (Key).
Understanding Opposite Colors on the Color Wheel
The assignment is easy to remember if you place the two models side by side. Cyan is the opposite of red, magenta the opposite of green, and yellow the opposite of blue. So if you remove color in a channel, you add the corresponding opposite color instead. This logic forms the basis for all color corrections with curves.
Using Green, Magenta, and Blue Selectively
If you switch to the green channel, you can add green by dragging upward. If you drag downward, magenta is produced. The same applies to blue and yellow: you add blue by dragging the curve in the blue channel upward, and yellow is produced when lowering it. This way you can tint an image very selectively.


Tinting the Shadows of an Image
A practical example shows how to use all this: you want to tint only the dark areas of the image reddish. To do this, you first set anchor points in the red channel in the midtones and in the bright areas so that they remain untouched. Then you drag only the point in the shadow area upward. The dark areas turn red, while the midtones and highlights remain largely unchanged.
Experimenting with the Channels
The combination of anchor points, channels, and the eyedropper offers you many possibilities. You can colorize the shadows, midtones, or highlights individually, or edit areas in between. In addition, the channels can be mixed with each other. Try out different combinations until the color look matches your vision.
Summary – Mastering Curves in Affinity Photo: Adjusting Contrast and Color Precisely
Curves are a versatile tool with which you precisely control the contrast and color look of an image. You start with the black point and white point, then set anchor points in the midtones and shape the curve according to your wishes. The S-curve is suitable for a classic contrast increase, and with the Luminosity blend mode you protect the colors from unwanted changes. With the eyedropper you work directly on the image, and with the RGB channels you edit colors in a targeted way. If you memorize the opposite colors Red–Cyan, Green–Magenta, and Blue–Yellow, color correction becomes much easier for you.
FAQ
How do curves differ from levels?Levels work with a black point, midpoint, and white point, whereas with curves you can set as many anchor points as you like and thus control the contrast more precisely.
Why does the color sometimes change when I increase the contrast?A contrast increase often boosts saturation. Switch the blend mode of the adjustment layer to "Luminosity" so that only the brightness is changed.
How do I remove an anchor point again?Right-click on the anchor point and select the option to delete it.
What does the eyedropper do in curves?The eyedropper sets anchor points directly in the image. If you drag the mouse downward, the tonal value under the cursor is darkened; if you drag it upward, it is brightened.
How can I change the color in individual tonal ranges?Select a color channel in the menu at the bottom of the dialog box, for example Red, set anchor points in the unwanted areas, and move only the point in the desired tonal range.
Which color results when I remove color from a channel?The opposite color is added to the image. Removing red results in cyan, removing green results in magenta, and removing blue results in yellow.


