In the field of software development, a thorough understanding of programming methods is essential, especially when it comes to return values. In this guide, we will focus on the use of the debugging tool in C# to determine how our methods work and to ensure that our code delivers the desired return values. We will look at how to set breakpoints to follow the program flow step by step and identify potential errors.
Key insights
- Breakpoints allow you to stop the program flow intentionally.
- Hybrid analyses of variable values can detect errors early on.
- Debugging is an effective tool for troubleshooting and reliably analyzing methods with return values.
Step-by-Step Guide to Applying Debugging in C
To familiarize you with the debugging process, let's look at the defined steps you can follow to effectively monitor the flow of your C# methods.
Set Breakpoint and Start Program
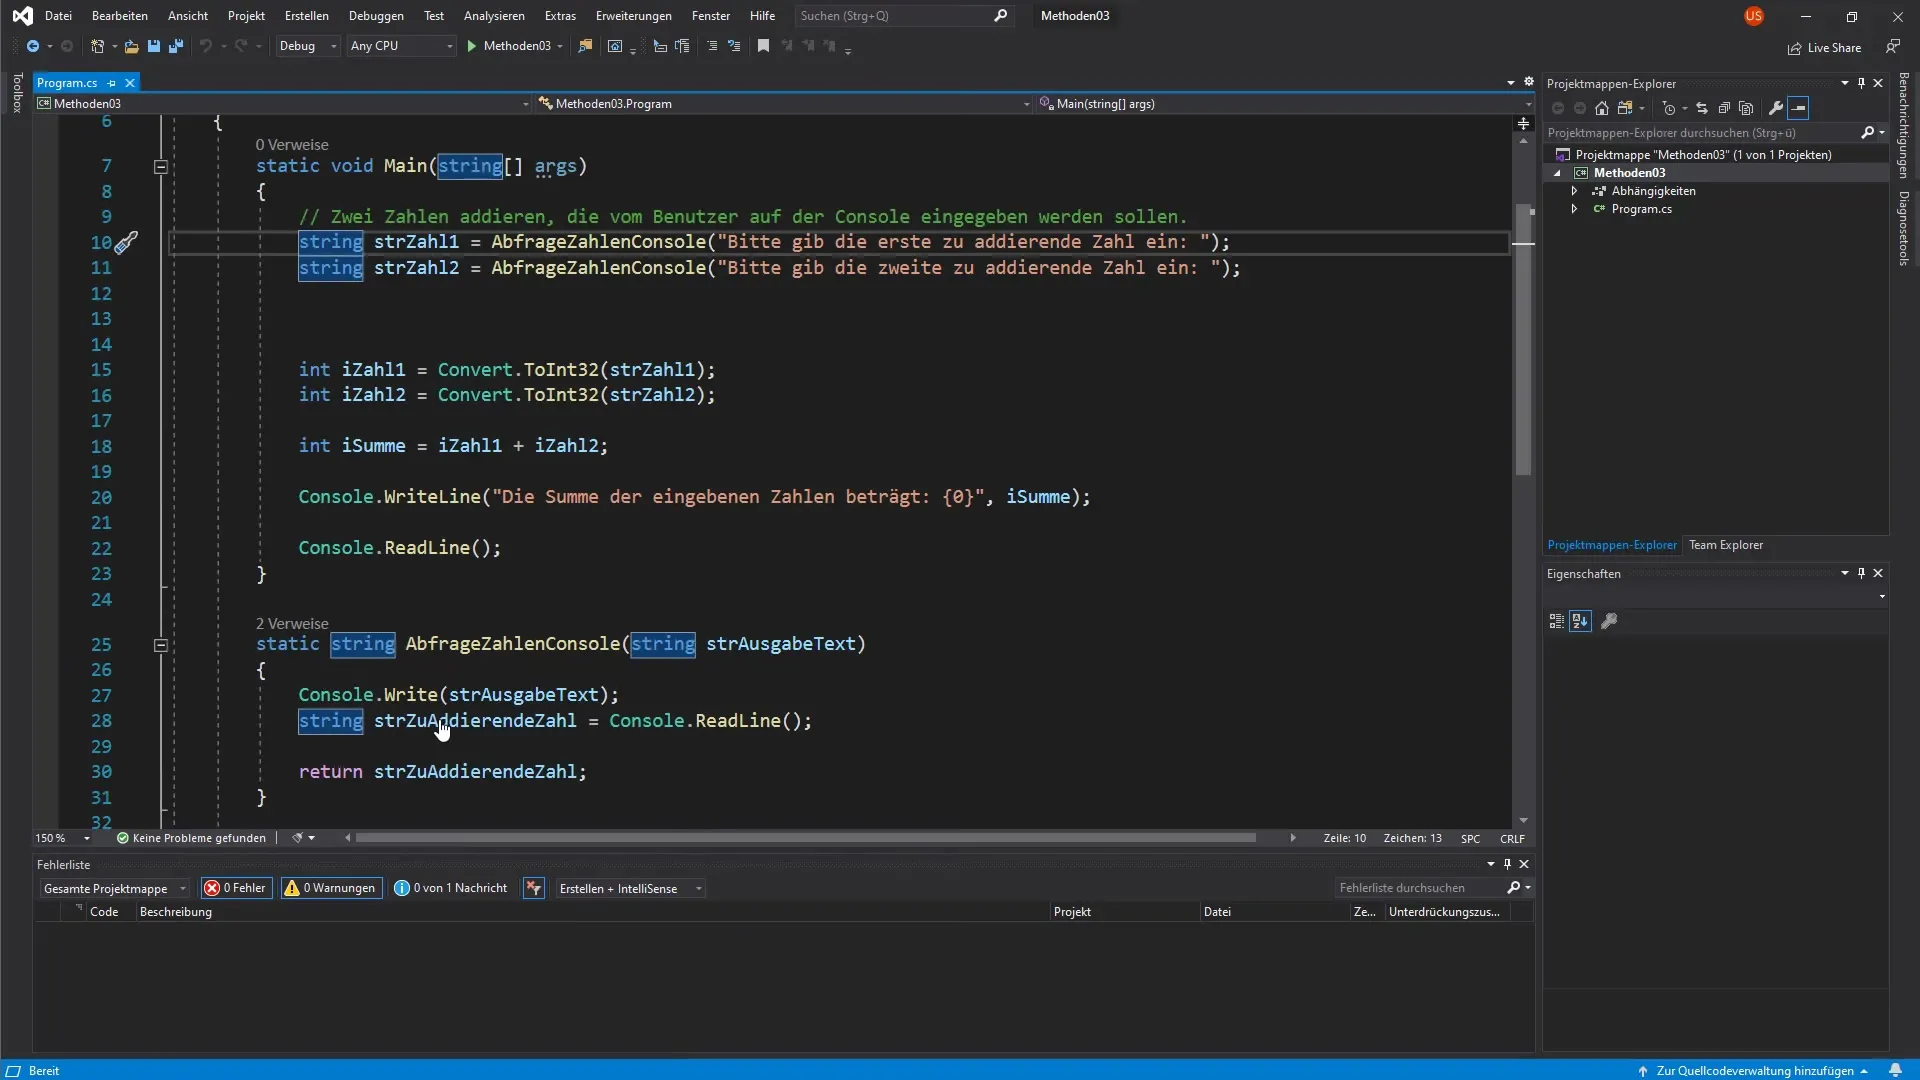
First, you need to set a breakpoint in the code. To do this, click on the left side of the line where you want to place the breakpoint. Visual Studio indicates this with a red mark.

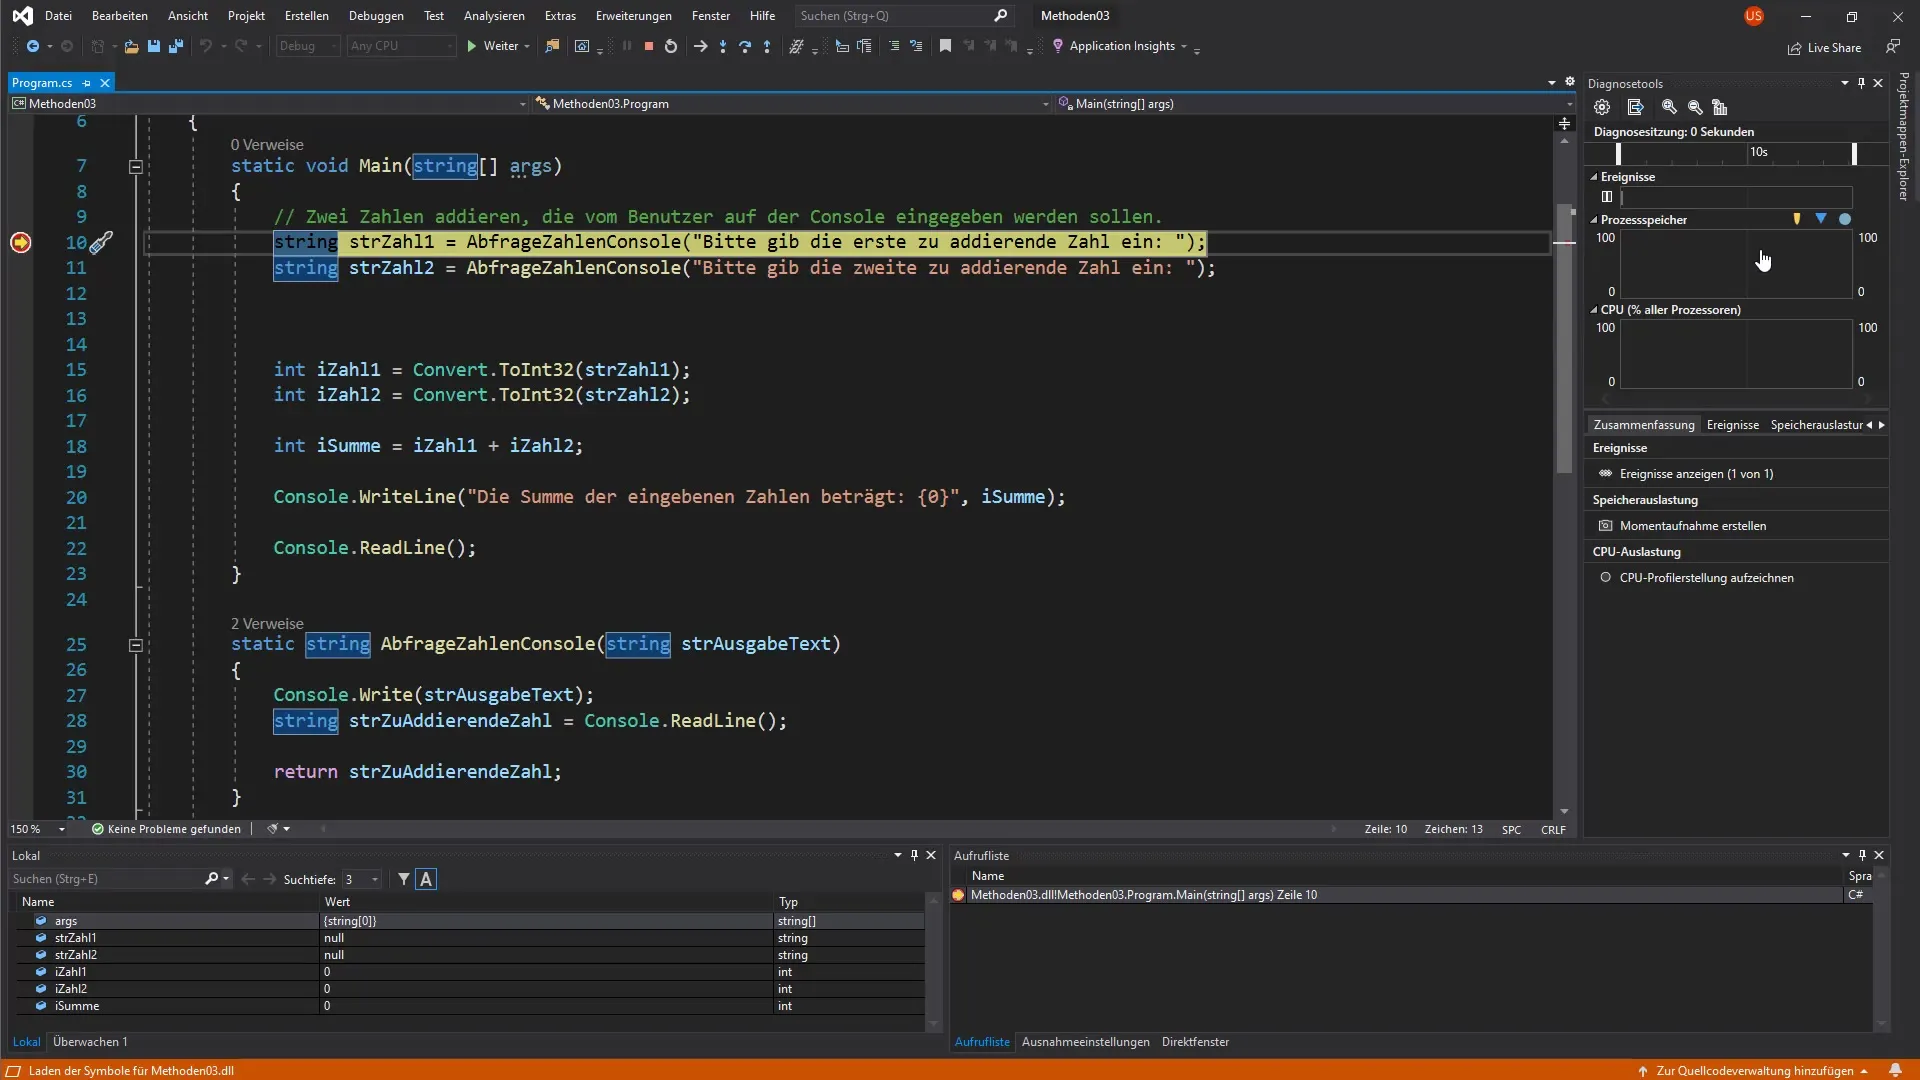
Now start the program. The compiler will automatically stop at the breakpoint, allowing you to follow the execution step by step.
Windows and Displays During Debugging
Once the breakpoint is reached, you will see several new windows in Visual Studio. In particular, there is a debugging window with a section for local variables and a call stack. This display helps you recognize which values are currently stored in the variables and which code line you are on.

Interacting with the Debugger and Variable Analysis
As you step through the debugger, you can examine each line of code individually. This typically happens by pressing F11. With each step, the value of the variable is updated in the local display area.
Here you can see that before user input, certain variables, such as "Number 1" and "Number 2", still have null values. Once you execute the next step, the user's inputs will be displayed in the corresponding variables.
Querying and Checking Values
When you prompt the user to enter a value, you will see that the console comes to the forefront. After entering, for example, "20", this value will be highlighted in red in the local display. This indicates that the value of this variable has changed.
By checking the variables, you'll see that the implementation of the method with return values is actually working. The input is collected and can be used for further calculations.
Managing Return Values
Another step in debugging is observing return values. For example, when you execute the method for querying the numbers and press F11, you'll notice that the return value is precisely passed to the method being called.
The assignment of this value to a new variable can be traced in the "Locals" window, where the active values after the last execution are listed.
Debugging by Repetition
You will find that the process of checking values and setting breakpoints helps you to better understand the program flow. Repeat these steps for other methods or sections of your code by querying user inputs and tracking return values each time.
With each step, you will become more confident in using the debugger and be able to locate and fix errors more quickly.
Summary - Deepening C# Methods with Return Values and Debugging
Debugging in C# is an indispensable tool for identifying errors in the code and analyzing the behavior of methods with return values. By setting breakpoints and going through the program step by step, you can identify unused variables, track return values, and ensure that your code logic works as intended.
Frequently Asked Questions
How do I set a breakpoint in Visual Studio?Click on the red mark in the left margin next to the line to set a breakpoint.
What does it mean when a variable is displayed in red in the debugger?A red display indicates that the value of this variable has changed since the last execution.
How can I follow the execution of the program step by step?You can press F11 to step through the code one line at a time.
Why is the call stack important?The call stack shows you the current program flow and where the program is coming from, which is very useful for troubleshooting.
What do I do if I find an error in the code?You can adjust the code and run the debugger again to ensure that the error is fixed.


